
Written by Aaron A. Lee | WEST Consultants
Copyright © RASModel.com. 2010. All rights reserved.
While running unsteady flow simulations in HEC-RAS instabilities may occur when transitioning from the automatically created initial condition file to the first computed time step. These instabilities can be caused by mixed flow conditions, flow splits, or poorly defined initial conditions. A hotstart is another option available for defining initial conditions for the project model. This article presents one technique for setting up a hotstart run to help with initial conditions problems and to troubleshoot problem areas in your project model.
This is done by creating a new plan, using a flow file with a constant discharge as the upstream boundary, and a stage hydrograph as the downstream boundary over a 24 hour period. Typically 24 hours is long enough, but you may find that a longer hotstart period is required. The downstream boundary water surface elevation is defined artificially high, and over the simulation it is gradually reduced until it reaches the true starting depth for your project model. At this point the hotstart file will be written by HEC-RAS. In HEC-RAS lingo, the term “hotstart file” is used interchangeably with “Restart File” and “Initial Conditions file”.
STEP 1. Create a new flow file by opening the current unsteady flow file and navigate to File, Save As, and name it “hotstart”. Once saved, change the upstream boundary condition by selecting Flow Hydrograph under the Boundary Conditions tab. Change the discharge to a constant flow equal to that of the first timestep for the 24-hr period. In this example, shown in Figure 1, the entire Flow column should be modified to contain 155 for the full 24-hr simulation.

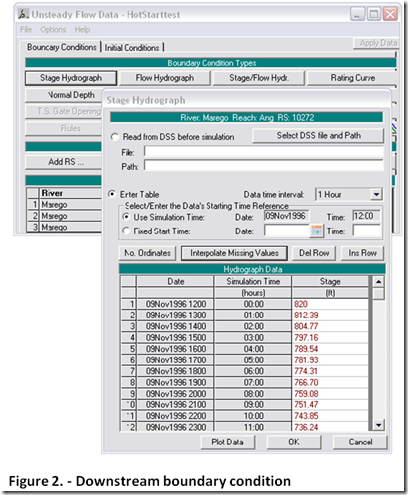
Select Stage Hydrograph as the downstream boundary condition. The beginning stage should start at an artificially high elevation - somewhere near the invert of the upstream-most cross section. The final elevation at the end of the 24-hr simulation should be equal to the starting downstream water surface elevation of the project plan. Once these values are added into the Stage column, use the Interpolate Missing Values button to add the missing elevations.
The elevation at each time interval should gradually decrease. This makes it easier for the modeler to observe problems as they occur, and where they happen in the model. For this example, the starting elevation is 820 ft and the final elevation is 637.25 ft. This is shown in Figure 2. Save the “hotstart” flow file.
 STEP 2. Navigate to the Unsteady Flow Analysis window and save as a new plan named “hotstart plan”. Name the short ID as “hotstart”. This will create a new plan that will be used to define the initial conditions for the project plan. Under the Unsteady Flow Analysis window select the Ending Date and Time to 24 hours after the Starting Date and Time (or whatever time frame you want to use-just be sure it is consistent with the hotstart flow hydrograph and stage hydrograph you created in Step 1).
STEP 3. The next step is to set up the model so that the hotstart file will be written. Under the Unsteady Flow Analysis window navigate to Options, then Output Options. Figure 3 shows this window.

Check the boxes that write the initial conditions file at the Fixed Reference of the hotstart simulation ending date and time. At the end of the specified simulation time (24 hours) HEC-RAS will automatically write the initial condition file. The final step is to ensure that the hotstart plan is using the correct geometry file, and the created “hotstart” flow file. Once the plan is completed and saved, compute the Hotstart simulation.
STEP 4. The profile plot should be reviewed for problems with the hotstart model. This will indicate areas that may cause problems in your project model. Over the course of the hotstart simulation, as the water surface drops into place along your bed profile, look for hints of instabilities. If you hotstart simulation crashes, you’ll know exactly where to investigate-the intersection between the artificially high horizontal pool and the bed profile at the time of the crash. To use the hotstart file as your initial conditions, go to the Unsteady Flow editor of your project plan. Click on the “Use a Restart File” box and browse for the initial conditions file. This file will have an extension that indicates that hotstart plan number that created it, the simulation time (day-month-year) when it was created, and .rst. In this example, it should look like:
Workshop4.p03.10NOV2006.rst
*Warning-If you make a change to the geometry in your project model, you’ll have to re-run your hotstart simulation. However, once everything is set up, this is very easy to do. Simply open the hotstart plan and run it. Then open the project plan and run it.
Copyright © RASModel.com. 2010. All rights reserved.
While running unsteady flow simulations in HEC-RAS instabilities may occur when transitioning from the automatically created initial condition file to the first computed time step. These instabilities can be caused by mixed flow conditions, flow splits, or poorly defined initial conditions. A hotstart is another option available for defining initial conditions for the project model. This article presents one technique for setting up a hotstart run to help with initial conditions problems and to troubleshoot problem areas in your project model.
This is done by creating a new plan, using a flow file with a constant discharge as the upstream boundary, and a stage hydrograph as the downstream boundary over a 24 hour period. Typically 24 hours is long enough, but you may find that a longer hotstart period is required. The downstream boundary water surface elevation is defined artificially high, and over the simulation it is gradually reduced until it reaches the true starting depth for your project model. At this point the hotstart file will be written by HEC-RAS. In HEC-RAS lingo, the term “hotstart file” is used interchangeably with “Restart File” and “Initial Conditions file”.
STEP 1. Create a new flow file by opening the current unsteady flow file and navigate to File, Save As, and name it “hotstart”. Once saved, change the upstream boundary condition by selecting Flow Hydrograph under the Boundary Conditions tab. Change the discharge to a constant flow equal to that of the first timestep for the 24-hr period. In this example, shown in Figure 1, the entire Flow column should be modified to contain 155 for the full 24-hr simulation.

Select Stage Hydrograph as the downstream boundary condition. The beginning stage should start at an artificially high elevation - somewhere near the invert of the upstream-most cross section. The final elevation at the end of the 24-hr simulation should be equal to the starting downstream water surface elevation of the project plan. Once these values are added into the Stage column, use the Interpolate Missing Values button to add the missing elevations.
The elevation at each time interval should gradually decrease. This makes it easier for the modeler to observe problems as they occur, and where they happen in the model. For this example, the starting elevation is 820 ft and the final elevation is 637.25 ft. This is shown in Figure 2. Save the “hotstart” flow file.
 STEP 2. Navigate to the Unsteady Flow Analysis window and save as a new plan named “hotstart plan”. Name the short ID as “hotstart”. This will create a new plan that will be used to define the initial conditions for the project plan. Under the Unsteady Flow Analysis window select the Ending Date and Time to 24 hours after the Starting Date and Time (or whatever time frame you want to use-just be sure it is consistent with the hotstart flow hydrograph and stage hydrograph you created in Step 1).
 STEP 3. The next step is to set up the model so that the hotstart file will be written. Under the Unsteady Flow Analysis window navigate to Options, then Output Options. Figure 3 shows this window.

Check the boxes that write the initial conditions file at the Fixed Reference of the hotstart simulation ending date and time. At the end of the specified simulation time (24 hours) HEC-RAS will automatically write the initial condition file. The final step is to ensure that the hotstart plan is using the correct geometry file, and the created “hotstart” flow file. Once the plan is completed and saved, compute the Hotstart simulation.
STEP 4. The profile plot should be reviewed for problems with the hotstart model. This will indicate areas that may cause problems in your project model. Over the course of the hotstart simulation, as the water surface drops into place along your bed profile, look for hints of instabilities. If you hotstart simulation crashes, you’ll know exactly where to investigate-the intersection between the artificially high horizontal pool and the bed profile at the time of the crash. To use the hotstart file as your initial conditions, go to the Unsteady Flow editor of your project plan. Click on the “Use a Restart File” box and browse for the initial conditions file. This file will have an extension that indicates that hotstart plan number that created it, the simulation time (day-month-year) when it was created, and .rst. In this example, it should look like:
Workshop4.p03.10NOV2006.rst
*Warning-If you make a change to the geometry in your project model, you’ll have to re-run your hotstart simulation. However, once everything is set up, this is very easy to do. Simply open the hotstart plan and run it. Then open the project plan and run it.


