Pages

Showing posts with label mapping. Show all posts

Wednesday, February 10, 2016

Post-Processing: Creating Inundation Maps with very Large Terrain

Written by Mikell Warms  |  WEST Consultants 
Copyright © The RAS Solution 2016.  All rights reserved.   

We often have to deal with very large models covering hundreds of river miles.  The terrain data associated with these models can be equally massive, which can cause memory/processor issues when trying to delineate inundation maps.

This post is not concerned with pre-processing our model geometry. Instead, we have a completed model with results we are happy with, and now we want to make inundation shapefiles. This is often necessary when completing dam breach analyses/flood analyses/etc. 

There are typically two ways in which flood inundation shapefiles are created: (1) using HEC-GeoRAS and (2) RAS Mapper. Both methods can face uphill battles when terrain data begin to exceed 20-30 gigabytes, depending on performance characteristics of your computer. Below are some typical errors you may see when trying to create inundation shapefiles with RAS Mapper on very large terrain.


Figure 1: RAS Mapper Memory Error Messages

There IS a way to get around this using RAS Mapper. The first thing you’ll need to do is

Wednesday, December 16, 2015

The Advanced Hydrologic Prediction Service for Chehalis Washington

A great example of where flood inundation maps and accessible flood warning systems can help a community prepare for floods.


Contact:               Brent Bower                                                                      FOR IMMEDIATE RELEASE 
206-526-6095 x228                                                           December 15, 2015
                               
Flood Inundation Maps to Enhance Flood Forecasts for the Chehalis River

People living along the Chehalis River have a new tool from the National Weather Service to help them understand their risk during floods. A large section of the river is now depicted on flood maps that show people where the water will flow and what it will look like in their community when the river crests beyond its banks. The new flood inundation maps will also help local officials reduce flood impacts to communities by giving them more advanced information for planning.

Thursday, May 14, 2015

The Projection File

Written by Christopher Goodell, P.E., D.WRE
Copyright © The RAS Solution 2015.  All rights reserved.

RAS Mapper is a window in HEC-RAS that allows you to preprocess 2D areas, map results, and manage background images.  In future versions of HEC-RAS, RAS Mapper will become more and more prevalent in our HEC-RAS modeling experience.  As I understand it, eventually RAS Mapper and the geometry editor window may merge to form the front-end interface for HEC-RAS, replacing the iconic “Main RAS Window”.
image

But that’s speculation.  What is not speculation is that if you want to use HEC-RAS 5.0 for anything more than a very basic model, there is really no getting around using RAS Mapper, and by extension…The Projection File!  The projection file defines a specific geographic coordinate system and projection and is somewhat of a new thing for us HEC-RAS modelers (it has actually been a part of RAS Mapper since it’s inception, but now with 2D modeling and web-imagery in Version 5.0, RAS Mapper is becoming an integral part of HEC-RAS modeling). The projection file requires us to know something about geospatial mapping (i.e. GIS), which we really haven’t had to know too much of before as RAS users.  But if you wish to use RAS Mapper, and you will, you need to understand what the projection file is and how to get one.  Without it, RAS Mapper is pretty much useless.  Adding a projection file to our RAS project establishes the project’s geospatial reference.  Projection files have the extension *.prj.  Be careful not to confuse this with the HEC-RAS project file, also with an extension *.prj.  They both reside in your HEC-RAS project directory, but only a properly formatted projection file will work in RAS Mapper for setting your projection.

The projection file is really just a simple text file with keywords in a specific format.  In fact, it is a single string written in “Well-Known Text” format, or WKT.  It’s simple, easy to read and was created by the Open GIS Consortium.  Here’s what a projection file looks like on the inside.  Notice that there are some keywords, identified by all CAPS, followed by some data related to the key-word, contained in brackets [  ].  I've color-coded it to make it easier to see what goes with what.  The purple color denotes the highest order in the hierarchy, followed by blue, then green, then red.  In other words, a red keyword is a “child” to a green keyword, green is a child to blue, and blue is a child to purple. 

image

Each keyword and the bracketed data that follows is called a “clause”.  The first and primary clause, PROJCS, stands for Projected Coordinate System.  The projected coordinate system is made up of the following sub-clauses:

1.  Geographic Coordinate System (GEOGCS), which is based on degrees latitude and longitude and contains the horizontal reference datum (DATUM), and the reference meridian for longitude measurements (PRIMEM).  DATUM also contains a description of the shape of the earth (SPHEROID), which in the example above is the Clarke Ellipsoid of 1866.  Units (UNIT) are inferred here only for the GEOGCS, in this case degrees.
2.   Projection (PROJECTION), which is the projection from geographic coordinates (lat/long) to projected coordinates.  This is essentially how the three-dimensional spheroid (Earth) is projected to a two-dimensional viewing medium.  In the example above, Transverse Mercator is selected, which uses the Universal Transverse Mercator (UTM) coordinate system.
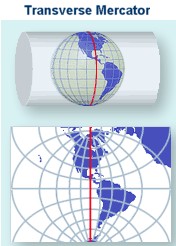

Cylindrical projection - transverse aspect © USGS

3.  Various projection parameter values (PARAMETER).  The parameter is labeled in quotations, followed by its value. 
4.  Units for the projected coordinate system (UNIT).  Here meters are used as the linear unit with a conversion factor of “1”.  The conversion factor converts the described units into meters.  If “FOOT_US” is used, then the conversion factor would be 0.30480060960121924.

There may be some additional clauses in your projection file, but the ones listed above seem to be typical.  All of the keywords used in WKT format with descriptions can be found at GeoAPI here.
You can write your own projection files and GeospatialPython.com presents a method (there are other examples out there, just Google it).  However, it is much easier and much more practical to find an already-compiled projection file and use that.  If you have a georeferenced HEC-RAS project already, every shapefile used to create your geometry components (stream centerline, xscutlines, flowlines, etc.) comes with a projection file.  Just find where it is stored on your computer and use that. 

If you don’t have the GIS files that were used to create your georeferenced HEC-RAS project, you can find projection files in at least three different places:  ArcGIS 10.0 or earlier, spatialreference.org, and the EPSG Projection Database.  If you know of others, please comment below!

When using any of these sources, make sure you pick the correct projection file.  You’ll know if it is the right one by bringing in web imagery to RAS Mapper and checking to make sure that everything lines up spatially correct.  ArcGIS (Versions prior to 10.1) includes a Coordinate Systems folder that contains more than 5,000 geographic, projected, and vertical coordinate systems.  Unfortunately, newer versions of ArcGIS do not come with that folder.  If you have ArcGIS 10.1 or newer or don’t have ArcGIS at all, you can access a large database of spatial reference systems at http://spatialreference.org/

image


If you go to spatialreference.org, make sure you only select from the EPSG, IAU2000, or spatialreference.org references.  The ESRI references only contain the GEOGCS clause in the projection file and not the complete PROJCS clause.  They will not work in RAS Mapper.   Once you’ve found the reference you want, click on it, then select “.PRJ File” from the list of available formats.  A projection file will then be downloaded to your computer and you are ready to use it in RAS Mapper.  There is a convenient Search box that allows you to search on key words for your reference.  For example, if your project is in Hawaii and you know your horizontal datum is NAD83, you can enter the keywords:  Hawaii NAD83, click the Search button and you’ll see the following list of spatial references:

image

Also available on line is the EPSG Projection Database, hosted on GoogleCode by geospatialpython.org.  Here you'll find a text file of a multitude of projection files in the correct WKT format that can easily be copied and pasted into your own projection file.

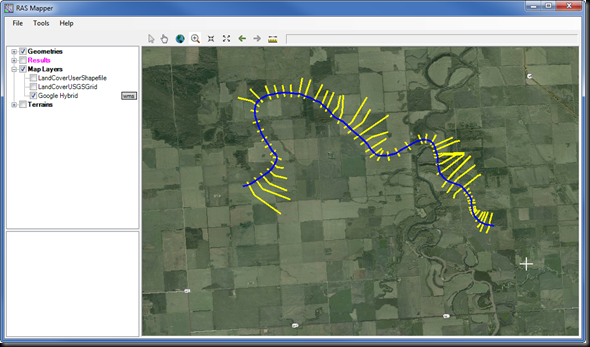
Once you’ve selected a projection file and assigned it to RAS Mapper, double-check that it is correct by adding web imagery.  If everything lines up, you are good to go.  The figure below shows the Muncie dataset in RAS Mapper, with an incorrect projection file assigned.

image

Obviously our streamlines and cross sections in this example are not correctly aligned in Muncie Indiana where they belong.  The incorrect projection file has landed us in the middle of Alberta, Canada!
image


Reassigning the correct projection file gets the model back to its correct spatial reference.

image

image

Does anyone know of any other sources of projection files that we can use in HEC-RAS?  If so, please comment below.

And here are some great follow-up comments from Dudley M.  Thanks Dudley for passing along this information!  "I was using RAS Mapper to set the SRS. From the menu Tools->Set Projection for Project. This brings up the "Spatial Reference Projection File" dialog where you can specify a filename. RAS Mapper will read the file and interpret as Chris described to get the coordinate system and projection.

I knew I had a valid ESRI projection file because it came from ArcCatalog. But RAS Mapper complained "Error - unable to make a projection with specified file. Make sure the file is a valid ESRI projection (*.prj) file." I looked in the projection file with a text editor. I saw that mine included a vertical datum clause. Chris didn't mention this in the post, so I thought maybe this was something RAS Mapper didn't like. The vertical datum information is introduced by the keyword VERTCS. I removed this entire part of the projection file and it worked.

But before it worked, I encountered another hitch. It's in that dialog "Spatial Reference Projection File." If you browse for a file and choose the same one you had before, the app does not read the file again. In other words, it doesn't refresh. I had to select a different projection file, choose OK, then go back and choose my edited projection file, and choose OK. For many minutes I was mystified why my edits to the file were not taking. I was making edits to the projection file in a text editor, then switching over to RAS Mapper and attempting to have it read the file again.

So if you get this error message even though you think you're giving RAS Mapper a valid projection file, try what I did."  

Wednesday, March 4, 2015

2D Mesh “Leaking”

Written by Christopher Goodell, P.E., D.WRE  |  WEST Consultants
Copyright © The RAS Solution 2015.  All rights reserved.

To follow up my post on fragmented inundation, I want to highlight another 2D mesh issue we should all be aware of.  Unlike fragmented inundation, which is an artifact of how HEC-RAS discretizes the 2D domain and the way it maps the results, Leaking is a result of terrain features not aligning with cell faces and/or cells that are too large, and can produce very wrong results. 
Take the following example of leaking.

image

Here we see a high ground feature that is straddled by rather large cell.  HEC-RAS will preserve the underlying terrain on the cell faces, but the cell itself is resolved to a volume-elevation curve.  Since the high ground feature runs diagonally through the cell, it is not picked up by the cell faces.  As a result, HEC-RAS does not know that there is a barrier that should keep water on one side of the high ground feature before it is overtopped.  The consequence is that water leaks through the high ground and is available to move further down the channel even before the high ground is overtopped.  This is incorrect.  To better capture the high ground feature, cell faces in this vicinity should be aligned to the high ground feature so that the terrain is picked up on the cell faces, which will prevent leakage.  The following figure shows the resulting flood map at the same time in the simulation as the figure above. 

image

Here we see the entire mesh has been overall refined to a smaller cell center spacing, but in addition, much more resolution was added by manually straddling cell centers around the high ground feature.  Notice around the crest of the high ground feature, the cell centers were placed to align the cell faces with the contours.  This ensures that the high ground is picked up by the cell faces.  The result is a higher resolution flood map, but also, and more importantly prevents leakage through the high ground before it is overtopped.  Also important is to provide much smaller cells on the downstream slope of the high ground feature, to prevent fragmented inundation.  In hindsight, I probably went a little overkill on adding cell centers, but it didn’t really add any noticeable time to the simulation, so I’m good with it. 
Manually adding cell centers is not particularly precise, and can take a bit of time.  Fortunately HEC will be including a new feature in the full release of 5.0 that allows the user to define a breakline along high ground terrain features like this.  The mesh is then generated, automatically aligning the cell faces to that breakline. 

Wednesday, February 18, 2015

2D Troubleshooting – Fragmented Inundation

Written by Christopher Goodell, P.E., D.WRE  |  WEST Consultants
Copyright © The RAS Solution 2015.  All rights reserved.

(Initial post 19 Feb., 2015.  Updated 20 Feb., 2015).  I continue to be more and more impressed with how user-friendly and robust the new 2D feature is in HEC-RAS.  However, there are some issues to be aware of, particularly in how results are mapped.  I want to take the next two blog posts to highlight two of the more important mapping problems to be aware of.  Today’s post covers what I call “Fragmented Inundation”, or fragmented mapping.  If you’ve run some 2D data sets already, you are likely to have seen this, especially if your 2D area starts off dry, you have steep terrain, and/or your cell size is too large.  Fragmentation usually shows up just as a part of a 2D area becomes wet (i.e. very shallow depths), and tends to go away as depths increase.  Very rarely do you see fragmentation in the maximum water surface plot.  Here’s an example of fragmented inundation:
image
Notice the isolated “ponds” of water in some cells, disconnected from the water in its neighboring cells.

Monday, January 12, 2015

HEC-RAS Model with 2D Mesh Only.

Written by Christopher Goodell, P.E., D.WRE
Copyright © The RAS Solution 2015.  All rights reserved.

There have been many questions lately about whether HEC-RAS 5.0 can perform a simulation with ONLY a 2D mesh (i.e. no cross sections).  The answer is yes.  In fact, in many ways it’s a lot easier.  In this example, the standard Muncie project offered by the Hydrologic Engineering Center has been converted first to SI units, then to a single 2D mesh.  To keep things simple, the levee breach was removed and flow moving into the overbank areas is purely due to overtopping of the levee.  The following figure presents the geometry file for Muncie when modeled with a single 2D area.   

image


Once you’ve drawn your 2D area boundary and have assigned a mesh cell center spacing (DX and DY) and Manning’s roughness value(s), really all that is left is to

Friday, September 5, 2014

Web Imagery for RAS Mapper in Version 5.0

Written by Christopher Goodell, P.E., D.WRE  |  WEST Consultants
Copyright © The RAS Solution 2014.  All rights reserved.

There are a lot of new features in Version 5.0.  We’ve discussed quite a bit the new two-dimensional capabilities.  But a real pleasant surprise for me was how great the new RAS Mapper is.  I’m going to try to highlight some of these new Mapper features over the next few months, but in this post I’ll share perhaps my favorite added tool:  Web Imagery. 
RAS has had the ability to add background images for quite a while now.  And when RAS Mapper was introduced in Version 4.1, it too had that feature.  But if you wanted to add aerial photographs behind your project, you had to go and find them.  There are many sources on-line for that:  some good, some not-so-good.  But, once you found the aerial photos, it was common to have to spend some time re-projecting them into the geographic projection and coordinate system you are using.  That all took time working in a GIS program, and frankly, some skill that I don’t have a lot of. 
In RAS Mapper in 5.0 a new feature called Web Imagery is added.  Web Imagery allows you to choose from 21 different web-based map types: Imagery, street maps, physical maps, topo maps, even infrared maps.  You can select these background images right from the RAS Mapper and they are re-projected on the fly. These come from a variety of hosts like ArcGIS, Bing, Google, NASA, and the USGS.  And each have worldwide coverage.  Some of these maps/images will work well for you, some won’t, depending on the scale and location of your project.  I have found that Google and Bing have excellent worldwide satellite coverage. 
And here’s where it gets really cool:  All of these maps and images are on the web, not your computer.  Just like in Google Earth as you zoom out, different, and less detailed images are used, so that you are not unnecessarily downloading more detail than you need.  As you zoom in, more detailed images are used so that you always have a nice crisp view.  This is all done seamlessly and very quickly.  And RAS only downloads what you need from the web for the current view extents you are at.  Take the Muncie demonstration dataset that comes with HEC-RAS 5.0.  I can zoom out to the full extent of the project and with Bing Satellite activated as my background image I have very nice coverage:
image
Now, I can also zoom in to a city block and have all the detail and precision I need. 
image
By the way, the time it took RAS to redraw the inundation, download and clip the more detailed image, and reproject the new image was only 2.5 seconds on my computer. 

To access the web imagery in RAS Mapper, first make sure your model is projected to a recognized projection system.  At the top of RAS Mapper, select Tools…Set Projection for Project…Here you’ll select a projection file (*.prj – NOT to be confused with a RAS project file!).  If it’s a proper projection file, you’ll see the Metadata show up in the window below.
image
Once your model has a defined projection, you can add web imagery by right-clicking on Map Layers in the Layer Manager and selecting “Add Web Imagery layer…” or by selecting “Web Imagery…” from the Tools menu item.  Once selected the following window will appear and you can choose any or all of the 21 available maps/images (you can only add one at a time though).
image

For most projects, you’ll probably be using Bing Satellite, ArcGIS World Imagery, Google Satellite, and perhaps some of the topo maps.  The quality and usability of these different maps will depend on your location and viewing scale (as you zoom in closer and closer, some of the maps will no longer load). 
Requirements for using Web Imagery in HEC-RAS 5.0:
1.  Your RAS model must be set to a known projection. 
2.  You have to have internet access (high speed is obviously better).

For more information about Web Imagery in HEC-RAS Version 5.0, check out the document “Combined 1D and 2D Modeling with HEC-RAS”

Get the lastest beta release of HEC-RAS Version 5.0 here.

Tuesday, September 13, 2011

Dam Failure of a Coal Slurry Impoundment

Written by Chris Goodell, P.E., D. WRE | WEST Consultants
Copyright © RASModel.com. 2011. All rights reserved.

I was recently asked my opinion on a good way to model the following dam breach event:
I …recently completed three consulting projects where I simulated the breach of three proposed coal slurry impoundments.  The permitting agency required a RAS model of an “instantaneous” hypothetical breach (over full depth, almost 80 ft for one of the impoundments).  I was able to achieve a stable model with brief breach formation time and satisfy the permitting agency.  The client (a coal company) considered the results to be unrealistic due to the rapid failure time and the fact that much of the impoundment is very viscous slurry; they have asked me to revisit the problem.  They asked me to model a partial breach of the top 10 ft, which they estimate is the distance from the top of slurry to the top of impoundment and occupied by water for the failure scenario, followed by the viscous slurry.  I was wondering if HEC-RAS could model such a complex situation.  I was thinking it might be modeled using the sediment transport capabilities within RAS.  I do have properties of the slurry, including particle size distribution, etc.  I suspect a more complex model is needed, but wanted to get your opinion, since I frequent your blog and have seen many complex issues addressed with RAS.
Thanks to Jason Hill, Ph.D., P.E. for sending in this interesting problem.  I don’t know if it is ultimately the best solution, but one that I think may work is as follows:
to model the breach of a partial water, partial slurry impoundment, you’re going to have to get creative.  First of all, RAS technically cannot model highly viscous fluids, like mud or slurry flows.  Really your only option for a “RAS-Only” model is to bump up Manning’s n values to account for the highly viscous flow.  Without a means of calibrating these high n values, you really are just guessing when you increase them. 
Here’s my suggestion:  Not sure if this would work, but what I would explore is the use of a combination of HEC-RAS, NWS BREACH, and FLO2D.  First, assume the first “pulse” of flow (water flow) will be separate and distinguishable from the second pulse (slurry flow).  The initial (water) part of the breach and the first pulse can be modeled and mapped using HEC-RAS exclusively.  For the second pulse of flow, I would model the remainder of the breach using NWS BREACH.  This model will simulate the breaching process and will generate a breach outflow hydrograph for you.  An advantage of NWS BREACH over RAS is that it provides an input for sediment concentration of the breach flow.  Once BREACH has provided you with a breach outflow hydrograph, use that as the inflow to a FLO2D model.  I say FLO2D only because I’m familiar with it and it can model highly concentrated mudflows.  But any model that you can find that models mudflows will work in this case. 
In summary, you’ll end up with two hydrographs to route downstream and to map independently:  the water hydrograph, and the slurry hydrograph.  The “water” breach will be modeled, and the water hydrograph will be routed using HEC-RAS.  The “slurry” breach will be modeled with NWS-BREACH, and the slurry hydrograph will be routed using FLO-2D (or other model capable of simulating mudflow).”
Although I know a little bit about NWS BREACH and FLO2D, I freely admit I haven’t tried this before. I think it can be made to work but I can also foresee a few hurdles.  Namely, what happens when/if the slurry flow and the water flow ultimately mix together somewhere downstream?  How do you map that condition?    If any of you out there have other suggestions, please feel free to comment to this post.