Pages

Showing posts with label RAS Mapper. Show all posts

Monday, February 3, 2020

1D/2D Offline Connection Issues

Written by Chris Goodell | Kleinschmidt Associates
Copyright © The RAS Solution.  All rights reserved. 

I’ve mentioned this before, but I am thoroughly impressed with the robustness of the finite volume solution scheme used in 2D areas in HEC-RAS.  As long as your Courant Numbers are in a good spot, you rarely get errors and instabilities in 2D areas.  HOWEVER, the transition from 1D to 2D and back is another story.  In fact, the majority of errors I get in 1D/2D models occur there (either at the cross section to 2D area interface for inline connections, or in the cells adjacent to the lateral structure for offline connections).  In this post, I’m going to talk about the errors next to lateral structures at 1D/2D boundaries.

Take this for example.  The model runs well with friendly blue bars everywhere.  But I just can’t let go of the 5.154-ft error.  It only happens once and obviously doesn’t cause the model to crash.  But it’s there, and a 5-ft error is a little more than I can stomach. 

My usual go-to output for cross section errors, the water surface profile plot, gives me no clues as to what is wrong.  In RAS Mapper, I have what appears to be a flooded situation around the time where the error occurs, but reasonable looking results.  I turned on the Update per Screen option in the Velocity Layer Properties window, so that I could optimize the velocity scale for this view.  Here I noticed that the maximum velocity is 11.5 feet per second (fps) (which is about 3.5 meters per second).  This is way too high for this river, and in fact while hovering around the centerline of the river, I get maximum velocities of around 2.8 to 2.9 fps.  But since the Update per Screen option is turned on for velocity here, that indicates that there is a hotspot velocity of 11.5 fps somewhere in this view.  I just have to find it. 

On closer inspection, I can see some lighter shades of blue and green (i.e. higher velocities) in the floodplain adjacent to the lateral structures (as highlighted in the white circles).  Knowing that cells adjacent to lateral structures are typically going to be the culprits in 1D/2D models, I zoomed in to the cells around the lateral structures to get a closer look.  I started with the circled area to the right, since that was closest to the cross section that generated the numerical error of 5.154 ft.    


While zoomed in, it was hard to see at first, with the terrain turned on, so I turned off the terrain and noticed this little sliver of high velocity right at the boundary of the 1D river and the 2D area.


Turning the velocity off and the terrain back on, you can see how the 2D area dips into the main channel just slightly, and in fact it overlaps the lateral structure as well.  This reveals a very typical problem that you can run into with 1D/2D offline connections with lateral structures.  For a given timestep, RAS will compute a volume of water going over (or through in the case of gates and culverts) the lateral structure into a given cell.  But if the receiving cell has a small sliver of low lying area, like in this example, that relatively small amount of volume could be enough to significantly raise the water surface in the cell.  Perhaps enough so that it is even higher than the water surface adjacent to it in the 1D reach.  This would then send water back the other direction the next time step.  Besides the numerical shock of a sudden and large rise in stage, the oscillating effect of sending water back and forth can set up errors that persist, grow, and lead to an instability.

Now if you’re using the weir equation on the lateral structure, you could change your weir submergence decay exponent from the default value of 1 to 3 (1 is the most accurate, 3 is the most stable).  This has a dampening effect on the oscillations and errors you get from this situation.  Read more about the weir submergence decay exponent in the HEC-RAS User's Manual on page 8-41.  You might also reduce the weir coefficient.  This will reduce the volume of water that transfers from the river to the cell for a given timestep.  If there is no elevated feature represented by the lateral structure (e.g. it is not a levee), you would want to use a very low weir coefficient on the order of 0.1 to 0.5, as discussed in the 2D Modeling User's Manual on page 3-50.  However, in this case, it might be better to just use the 2D equations over the lateral structure instead of the weir equation.  Using the “Normal 2D Equation Domain” (this is just a funny way of saying “Use 2D Equations”) is a relatively new feature available in lateral structures.  But if your lateral structure does not represent an elevated terrain feature (e.g. a weir or levee), then this might be the better option to use. 


However, in recognizing that the 2D area perimeter and the lateral structure are poorly located, I will fix this first to see if that’s all that is needed to solve the problem. 
First, I’ll pull in the 2D area to just beyond the high ground.  This can easily be done in RAS Mapper on the 2D Area Perimeter Layer while in edit mode.  Next, I’ll pull over the lateral structure so that it resides ON the high ground. 


In the current version of HEC-RAS (as I type this post), Version 5.0.7, you cannot edit lateral structures in RAS Mapper.  So you have to do it in the Geometry Editor for now, using the Edit…Move Points/Objects command.  After moving the lateral structure, I adjusted the location of the 2D perimeter again, so it is just inside the lateral structure.  Here you can see a much better placement of both the 2D perimeter and lateral structure. 


And don’t forget, since I moved the lateral structure placement, I have to re-extract the terrain onto it.  Fortunately, HEC-RAS gives us a short cut to do this with the Terrain Profile button. 


After re-running, the error is gone and the results look much better.  Notice the peak velocity in the scale is back to a normal value of 2.6 fps.  And the 5.154-ft error is gone!


Monday, February 25, 2019

Georeferencing hard copy or pdf maps

Written by Krey Price  |  Surface Water Solutions
Copyright © The RAS Solution 2019.  All rights reserved. 

Using RAS Mapper as a GIS tool Part 3:
Georeferencing hard copy or pdf maps


Have you ever received your background data in hard copy or pdf format and wanted to view it in its georeferenced location? For this final topic in our three-part series on using RAS Mapper as a GIS tool, we'll cover the steps required to georeference a map using world files. [For additional background see the previous posts Part 1: Terrain modification and Part 2: Web imagery with world files.] 


Before you begin any georeferencing process, always check that you are using the correct projection (and confirm the desired projection with the client or end user of the data.) If you don't know which projection to use, you may need to check with the provider of your LiDAR data or other geospatial data. If your terrain file has been provided in geotif format, another option is to add the terrain file to RAS Mapper without assigning a projection, then double click on the name of the terrain, select the "Source Files" tab, and click on the "Info" button to view the GDAL metadata. The projection should show up under the "PROJCS" tag:


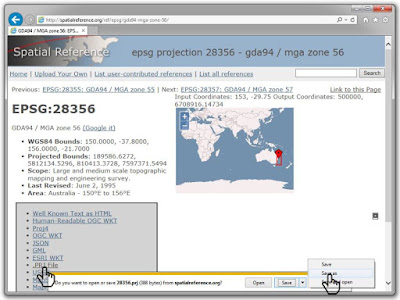
If you don't have the relevant projection file available, most projections (with the exception of local project grids) are available online for free download. Projections are typically catalogued according to European Petroleum Survey Group (EPSG) codes maintained by the International Association of Oil and Gas Producers. [When you think about it, it makes sense that the oil and gas industry would have a substantial interest in pinpointing global locations for exploratory wells and other critical geospatial data!]
Online repositories for projection files such as spatialreference.org include the EPSG code with each spatial reference system:


http://www.spatialreference.org


Projection files can also be copied from the prj file associated with any shape file that matches the target coordinate system. In any case, once I've got the correct prj files, I like to place it in a separate subfolder named "projection" that I create under my project directory, and then assign it a file name such as "GDA 94 MGA Zone 55 Projection.prj" that clearly distinguishes it is a projection file (as opposed to a HEC-RAS project prj file!) I also like to make sure that the projection folder includes only a single prj file so that anyone who picks up the project in the future knows the intended projection. [RAS Mapper sometimes loses the spatial reference system association and that can avoid confusion when it is re-assigned.]
Once you've confirmed that you are using the correct projection (typically by turning on web imagery and checking that it lines up with your terrain, shape files, or other geospatial data for your project) you can georeference any hard copy, scans, image files, or pdf files within the specified projection.
The georeferencing steps are covered on our new YouTube channel in this video walk-through beginning at 6:37:

https://youtu.be/5REWQ8Z_08I
Here are the steps covered in the video: 


1. For hard copies, scan your image to a raster format (commonly jpg or tif). For pdf files, use "save as" in Adobe Acrobat and select jpg (resolution can be adjusted under settings). For other file types, you may wish to use the Snipping tool that ships with Windows and save the screenshot as a jpg (best if it's on a high-resolution screen as you'll be stuck with the screen resolution and not the original source file's resolution).
2. Create a new file in Word, Notepad, Wordpad, or other text editor or word processor (or copy an existing world file and skip to Step #5).
3. Enter six lines of numerical text. Use dummy values from "original world file" column in the World File Calculator spreadsheet (available for free downloaded here) or take an initial guess at values based on the assumed coordinates of the upper left pixel.
4. Save file as plain text format (*.txt) using the same file name as the image file (select "default settings" if prompted).
5. Change file extension in Windows Explorer to *.tfw, *.jgw, *.bpw, etc. as appropriate to match your image file format (click yes if prompted with unusable file warning).


6. Under Map Layers in RAS Mapper, right-click and select "Add Existing Layer". Be sure to drag down file types to show all image files. Browse to file and select OK.
7. Using the measure tool in RAS Mapper, measure the distance between two points that are a known distance apart (preferably from a scale bar or coordinate tick marks on the map).
8. Open the World File Calculator spreadsheet (or create your own - there's really not that much to it!) and enter the measured and actual distances under Line #1 (cells D3 and E3) and again in Line #4 (cells D6 and E6).
9. Copy values from "New World File" column, open the world file in a text editor, and paste the updated values over the old values.
10. Right click on the image file and select "remove layer".
11. Re-add the image file and adjust transparency as needed.
12. Using the measure tool in RAS Mapper, click on a known point from the original image (with incorrect location), then double-click on the same known point based on the correct location.
13. Select "Copy coordinates to clipboard".
14. Paste the coordinates into Cell C10 in the spreadsheet (Note: values will be replaced in the cell range C10:F12 but only C10:D11 are used in the spreadsheet).
15. Copy "New World File" column over the previous values in the world file.
15. Remove and re-add the image file under map layers in RAS Mapper.
16. Adjust transparency as needed to confirm common points are now co-located. Measure the scale bar to confirm correct scaling.


Hopefully the first try will get you close enough for your purposes, but the process can be repeated to fine-tune the results as needed. You can also use these steps to convert geospatial data to or from a local project grid for which projection details are unavailable.


Keep in mind that these adjustments only provide a visual approximation and should be treated cautiously if the results are to be used for permitting or construction purposes. In that case, you'd want to get a surveyor on board with the proper tools to apply all of the required warping factors and address any other discrepancies. 


The full set of parameters in a projection file can get quite complex; projecting a curved surface to a flat plane comes with mathematical difficulties that have plagued mapmakers for centuries. Here's a great video explaining why all world maps are wrong.


www.surfacewater.biz/projection/


With these difficulties in mind, it is no surprise that even if you get two points to line up perfectly, a third point can still be shifted, particularly for points located a significant distance away from the alignment points. For manual georeferencing, I suggest using alignment points that are as far apart as possible for your selected zoom extent to avoid major discrepancies.
Note on rotation factors: The above steps assume that north is straight up in your hard copy or pdf map based on the applied projection (or at least close enough to straight up to suit your purposes). If not, rotation terms can be added to the world file, but in my experience this can lead to some confusion, as the pixels shift on the fly at different zoom levels.


Although rotation terms can be added to the world file by measuring the angular difference between lines drawn between two known points, my preference is to make rotation adjustments graphically before diving into any world file adjustments. Raster images can be rotated in a number of programs (Photoshop, Paintshop, Word, PowerPoint, etc.) to achieve a proper north alignment. [The "Z axis rotation" can be used in Microsoft products to apply specific sub-degree rotation factors.] The rotation terms can then remain as zero values in the world file.
We hope you have found this useful for your work. Please let us know if you have any comments or suggestions for improving these processes! Thanks for tuning in, and as always, let us know your recommendations for upcoming blog topics.


Collecting ideas for future posts: One subject we are working on for a future post is hacks for removing flow from HEC-RAS models. Internal boundary conditions are very useful for adding flow anywhere in your model, but removing flow can be a tedious process requiring a bit of creativity. Some new features coming in Version 5.1 may simplify the process, but in the meantime I've seen some clever workarounds being applied that we would like to share with this forum; please contact me if you have done this successfully so we can perhaps feature your method in an upcoming blog post.


And speaking of Version 5.1, right at the top of my wish list for HEC-RAS updates is for project files to be called *.ras files, *.hrp (HEC-RAS Project) files or any unique extension that doesn't happen to coincide with thousands of other files on my computer (in this case, of course the ESRI-format *.prj projection files). I understand the Corps may have been first in this case (calling their project files prj's well before ESRI did) but the rest of the geospatial industry is not about to change their format, so maybe HEC-RAS project files can get a unique identity in the next version - or at least a search tool within RAS that can recognize and distinguish HEC-RAS-format project files. Let us know if you agree and maybe we can turn this into a grass roots, crowd-based request!


Monday, January 21, 2019

Shifting web imagery with world files for HEC-RAS


Written by Krey Price  |  Surface Water Solutions
Copyright © The RAS Solution 2019.  All rights reserved. 

Using RAS Mapper as a GIS tool Part 2:
Shifting Web Imagery with World Files


Have you ever tried pulling web imagery into RAS Mapper only to find that it doesn't line up with your existing shape files, terrain surfaces, or other geospatial data?  In this second of a three-part series on using RAS Mapper as a GIS tool we'll cover the modification of world files for georeferencing.

Photo by Franck V. on Unsplash

In some cases, the misalignment of web imagery may result from an incorrectly applied projection file. If needed, projection files can be downloaded for free from spatialreference.org and other online data sources. You can check the projection of your terrain file by double-clicking on it in RAS Mapper, then select the "Source Files" tab and view the metadata using the Info column. 


If you have confirmed that the correct projection file is being used and you are still having issues, there are a few additional workarounds you may wish to try. One option is to select the "Alternate HEC-RAS Raster Warping Method" under "Tools | Options" in RAS Mapper. This method applies the gDAL OGR vector reprojection. I have found this method useful for resolving discrepancies in European data sets in particular.


In some cases, the alternate method doesn't do the trick either. RAS Mapper uses the ESRI projection file format, which as I understand it does not recognize TOWGS84 parameters and in some cases improperly applies the proj.4 projection parameters. In any case, you may find yourself stuck with misaligned web imagery.


One workaround is to save static images of your web imagery and then shift the image to the correct location by making adjustments to the world file (Wikipedia has a good summary of the six lines of code comprising a world file here).


Here's a video walk-through of the process:


https://youtu.be/5REWQ8Z_08I


The "World File Calculator" spreadsheet referenced in the video can be downloaded here:


http://www.surfacewater.biz/wp-content/uploads/2018/12/Surface-Water-Solutions-World-File-Calculator.xlsx


Here are the steps covered in the video:


1. Adjust transparency as needed so that you can see a known point in both the web imagery and in the survey or LiDAR data.
2. Using the measure tool in RAS Mapper, click on a known point from the web imagery (with incorrect location), then double-click on the the same known point based on the correct location.
3. Select "Copy coordinates to clipboard".
4. Zoom to preferred extents for results and save view (click here for further details on saved views and static imagery).
5. Right-click on web imagery and select "export layer". Note: RAS Mapper currently has two export options: tif and jpg. The tif format will embed the metadata and georeferencing information into the encoded text of a geotif file without generating a separate world file. A tfw file can still be created to override the embedded georeferencing, but I suggest using the jpg format so that the world file is automatically generated. Save the image (I suggest creating an "aerial imagery" subfolder within the current project's directory structure to store static images).
6. Open the world file calculator spreadsheet.
7. Paste the coordinates from RAS Mapper into the blue cell.
8. Open the newly created jgw file (jpg format world file) in a text editor and copy the values.
9. Paste the values into the "Original World File" column of the spreadsheet.
10. Copy the "New World File" values over the original values in the jgw file, save, and close.  
11. Under Map Layers in RAS Mapper, right-click and select "Add Existing Layer". Be sure to drag down file types to show all image files and browse to the newly created file.
12. Adjust transparency as needed to confirm common points are now co-located.

The process can be repeated to fine-tune the positioning. Because a static image won't be pyramided like web imagery, you will unfortunately need to complete these steps at every desired zoom level and view extent, the but the process of saving static images allows you to control the appearance of your figures without having to worry about losing your internet connection while presenting or viewing results.


Note that these steps assume the units and north alignment are the same (or close enough) between the data sets and that the static image can be simply shifted without scaling or rotation factors, which we'll cover in more detail in our next post.
Please let us know any feedback or suggestions for improvements or additional efficiencies in adjusting web imagery.


Monday, January 7, 2019

Removing bridge decks from terrain surfaces

Written by Krey Price  |  Surface Water Solutions
Copyright © The RAS Solution 2019.  All rights reserved. 

Using RAS Mapper as a GIS Tool Part 1:
Removing Bridge Decks from Terrain Surfaces


This is the first in a three-part series on using RAS Mapper as a GIS tool. In this post we'll cover the removal of bridge decks from terrain data.


This topic comes up fairly frequently, since LiDAR data may be inconsistent in terms of the inclusion or exclusion of bridge decks. Depending on how you would like to model a bridge, you may prefer to have the bridge deck represented as terrain or as a deck/roadway defined with station/elevation points (in which case the deck geometry might be best excluded from the terrain data). In either case, you may find yourself needing to modify terrain data to suit your modeling needs.


In a previous post on terrain modification, we covered how to burn channels, levees, buildings, basins, and other features into your terrain surface using RAS Mapper. One application we left off (because it is the example covered in the HEC-RAS manual) is the removal of bridge decks; given some of the feedback we received on the previous post, we thought it might be worth including bridge decks in the process as well.


The process of removing a bridge is actually quite simple, as is the process of inserting some basic deck geometry into your terrain data. We walk through the complete steps for both removing and adding a bridge in less than 5 minutes in this video walk-through:


https://youtu.be/MWYKW-6D0FU


Here's a screen shot of Page 2-11 in the HEC-RAS 2D User Manual showing a bridge deck included in the terrain data and then removed from the terrain data. Now you see it, now you don't:


The following images are courtesy of Cameron Paintin from Riley Consultants, who applied these steps for a project in New Zealand.


Here is the terrain surface with the bridge deck in it:


Here is a satellite image with the bridge:


In this screen shot, Cameron has drawn a river reach with cross sections on either side of the bridge:


This process can be repeated with additional reaches for any other bridges in your terrain. The following screen shot shows the interpolation surface created by the bounding cross sections:


And the final image shows interpolation surface on top of the terrain to blend out the bridge:


Let us know what you think or if you have other suggestions for improving these processes.


And a happy 2019 to all of the fellow HEC-RASlers around the world!


Tuesday, July 17, 2018

HEC-RAS Primer for New Users


Written by Chris Goodell  |  Kleinschmidt Associates
Copyright © The RAS Solution 2018.  All rights reserved

Are you a new HEC-RAS user?  Or maybe you've used HEC-RAS before, but it's been a while.  Maybe you have no idea where to start.  Steady or Unsteady?  1D or 2D?  Subcritical or Supercritical?

OK, for all you Newbies out there, I'm going to walk you through some steps to take to get you up and running with your first HEC-RAS model.  
1.    Take a HEC-RAS Training Course.  There is no better and faster way to get the knowledge you need to start right in on a HEC-RAS model than to attend an in-person HEC-RAS training course. 
 

If you are brand new, start with a Basic 1D Steady Flow HEC-RAS Course.  There are several of these types of courses out there.  Some may be close to where you live, but be prepared to have to travel-and spend some money.  You can Google “HEC-RAS Training” and find a bunch of options.  Here are a few regular offerings that I can recommend:
·         ASCE Continuing Education.   Typically only available in the US, and expensive.  But the quality is top notch.  Click the link to see where classes are currently scheduled. 
·         National Highway Institute.  Only available in the US.  Courses are not always offered, and when they are you’ll have to get on a waiting list, unless you work for the Federal Highway Administration
·         Hydrologic Engineering Center.  Expensive and priority given to U.S. Government Employees.  Non-government employees can sign up, but only if space is available.  Also, courses are held in Davis, California.  But hey, these are the folks that develop the software, so if you can get in, take it!
You may also hear from time to time about a HEC-RAS course hosted by a local professional organization or government agency.  Keep your eyes and ears open for these.  One option near me is River Restoration Northwest, which hosts HEC-RAS classes in the Northwest USA every couple of years. 
Aside from pre-scheduled courses, you can always bring an instructor to you.  This only pencils out if you have multiple folks that you need to train.  Usually 6 to 10 and the price per student drops below the pre-scheduled courses.  I am able to provide this training as can my friend and colleague Krey Price, who is located in Western Australia.  WEST Consultants is also able to provide custom course training. 
2.    Read the HEC-RAS Manuals.  Please please please read through the HEC-RAS manuals before you try to do any HEC-RAS modeling.  Don’t take my polite use of the word “please” three times as a suggestion.  Think of it as the First Commandment of HEC-RAS Modeling.  I guarantee that if you adopt the strategy of “When all else fails, read the manual”, you will end up wasting a lot of your time. 
At the very least read through the HEC-RAS User’s Manual.   All of the HEC-RAS manuals are very well written, easy to follow, and packed with information.  They come with the installation of HEC-RAS, but if you don’t have them, you can get them from the HEC website.  HEC offers the following manuals for HEC-RAS:
·         User’s Manual.  Start here.  At the very least, read through this manual before any HEC-RAS modeling.
·         Hydraulic Reference Manual.  As the name implies, a good reference resource.  This is where I go to learn about the “guts” of HEC-RAS…the theory behind it.  And to see what’s happening under the hood.  You do not need to read this cover to cover to get a HEC-RAS model running, but it’s good to check in for certain features in HEC-RAS that you’d like to know more about-specifically the theory and computational schemes behind the feature. 
·         Applications Guide.  A fantastic collection of example data sets with instructions on how to set them up. 
·         Two-Dimensional Modeling User’s Manual.  Definitely read this if you plan on doing any 2D modeling. 
·         5.0 Supplemental User’s Manual.  Good to read if you want to learn about the new features in Version 5.0.  Especially give this a read if you wish to take advantage of the new RAS Mapper preprocessing editing tools. 
·         BSTEM Technical Reference & User’s Manual.  If you don’t know what BSTEM is, there is no need for you to read this manual.
3.    Example Projects and Applications Guide.  When you download HEC-RAS, you not only get the software, but you get all of the manuals listed above, plus some other useful documentation.  You also have the option to download a larger install package that contains the Example Data Sets.  DO THIS!!!  These example data sets are invaluable.  As you can see in the figure below, the example projects are organized into 5 folders after you download them and unzip them to your computer.  Notice the fourth folder called “Applications Guide”.  These are all of the HEC-RAS projects documented in the Applications Guide manual.  If you want to do some self-training, there is no better way than to go through each of these Application Guide Examples one by one.  In fact, I highly recommend going through at least a handful of them before taking a training course.
The Applications Guide is designed to provide example projects for you to work through alongside instructions for a wide variety of HEC-RAS applications.  In fact, the manual has examples that cover just about every kind of geometric element you may want to use, including bridges, culverts, dams, lateral structures, storage areas, junctions, etc.  Unfortunately, the current Applications Guide does not have any 2D examples, but there are 2D examples in the HEC-RAS Example Data Sets. 

4.     Online Resources.  Since you’re reading this, you’ve already found The RAS Solution, the best online resource for all things HEC-RAS.  With over 200 posts about HEC-RAS, you are bound to find the information you are looking for (for example…this post 😊).  There is a search bar near the top of The RAS Solution, where you can enter in some key words to help you find articles on topics you are interested in.  The RAS Solution also has a very widely used forum, where you can ask questions, but also give back to the HEC-RAS community by posting answers.
There are a number of social media sites out there dedicated to HEC-RAS.  These are great ways to not only get the latest information about HEC-RAS (e.g. upcoming courses, new version releases), but also to post questions about HEC-RAS.
https://www.facebook.com/TheRASSolution.  This is the Facebook site for The RAS Solution.  When a new post goes up on The RAS Solution, a link to it goes on this site. 

https://www.facebook.com/groups/90473474105/.  This is an all-purpose HEC-RAS User’s site on Facebook.  With nearly 2000 members, there is a lot of interaction on this site.  Great place to pose questions and get answers. 
https://www.facebook.com/groups/571614272961250/.  For my HEC-RAS friends from Italy, this is an Italian language HEC-RAS help site run by my friend and colleague Antonio Cotroneo. 
https://www.facebook.com/groups/906806026048714/.  This is a Brazilian HEC-RAS site that generally caters to our Portuguese-speaking friends.  This site is administered by my friend and colleague Pedro Sydorak.
https://www.linkedin.com/groups/7065494.  This is the LinkedIn site for The RAS Solution.  When a new post goes up on The RAS Solution, a link to it goes on this site. 
https://www.linkedin.com/groups/1908568.  This LinkedIn site has over 5000 members.  A lot of great RAS modelers participate on this site.  Unfortunately the administrator of this site doesn’t participate and so it tends to get a lot of spam and advertisements, and the “About” section is about 10 years out of date.  Still, there are some pretty good discussions on here with lots of participation.   
https://twitter.com/RASModel.  This is my twitter feed.  I post links to all of The RAS Solution posts up here as well as other useful HEC-RAS information.  I also occasionally post about some of my favorite sports teams.