
Written by Chris Goodell, P.E., D. WRE | WEST Consultants
Copyright © RASModel.com. 2009. All rights reserved.
It's common knowlege that HEC-RAS cannot go "dry" at any time during a simulation. However, very low depths can be problematic as well. Very low depths can lead to compounding errors that can cause instabilities, and eventually your model to crash. There are a couple of tricks to get around this problem. Pilot channels and added base flow. None of you inflow hydrographs should start with 0 inflow, unless there is sufficient backwater in you system to prevent the upstream cross section from going dry. The trick with adding base flow is to keep it as small as possible, while providing the necessary stability. Try 1% of the peak of the hydrograph. You definately do not want to add a significant amount of volume to your model before the flood wave arrives-that will limit the extent of hydrograph attenuation you'll get.
To add base flow to an inflow hydrograph, simply add a minimum flow value in the box at the lower left corner of the flow hydrograph editor. Then, for that hydrograph, RAS will use the base flow amount any time the hydrograph flow is less than the minimum flow value.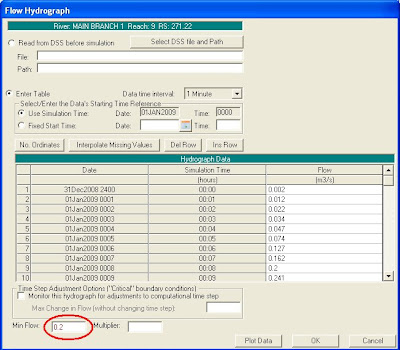


