Pages

Tuesday, December 30, 2008

Extra Precision in Interpolated Cross Sections

Written by Chris Goodell, P.E., D. WRE | WEST Consultants
Copyright © RASModel.com. 2008. All rights reserved.

Here's a question I got recently:

"When interpolating cross-sectional data, HEC-RAS truncates after 4 decimal places. We have a very flat system and this is causing problems with our model because every time it truncates, there is a step discontinuity in the results which manifests itself as an instability in the energy gradient. How can I extend the precision in HEC-RAS to 6 digits after the decimal place?"

try this: Perform a datum adjustment for all the geometry (cross sections, bridges, inline structures, etc.). Adjust by a factor of 100. Or 1000, whatever works. This can be done very quickly in the geometry schematic under Tools…Datum Adjustment. So let’s say you have an invert of 5.432615 meters at River Station X. You now have an invert of 543.2615 (and all the other elevations in the geometry will change as well). You have now bought yourself another 2 decimal places to work with when you interpolate. Then after interpolating with a precision of 4 decimal points, datum shift again, by a factor of 0.01 to get back to the real elevations-make sure you maintain enough decimal points during the datum shift to avoid rounding off the extra precision you just obtained.

A potential problem is when you go to save the data. I believe RAS uses double-precision floating point numbers for elevations when storing data to internal memory (RAM)-this gives you LOT of decimal places. However, once the data is written to a file, it is reduced to a single precision number-which is limited to 7 digits and a decimal point (or 8 digits without a decimal point). So if you have an elevation of 1234.56789 ft, it will be reduced to 1234.568 when written to the geometry file. You'll also see this in the cross section editor. Values are reduced to single-precision floating point numbers. I imagine this will only be a problem if you’re working with high elevation streams. Again, this can be avoided by setting an arbitrary datum near the downstream end of the model so that smaller numbers can be used.

Monday, December 29, 2008

Modeling a spillway and culvert combination


Written by Chris Goodell, P.E., D. WRE | WEST Consultants
Copyright © RASModel.com. 2008. All rights reserved.
 
What's the best way to model a culvert with a flow controlled spillway stuck on the front like this for a dam breach simulation?
You could try putting a cross section just upstream of the bridge/culvert to include the spillway crest (as part of the cross section station elevation points). You’ll have to “straighten out” the spillway, but just make sure the overall length is correct. This will only work if the culvert (in the picture) is the only flow passage through this structure (i.e. it’s in the main channel), and the spillway obstructing can be modeled across the entire cross section. This may be difficult to stabilize for an unsteady flow model so here are a couple of other options to try out if needed.

For a dam breach model, you’re probably looking at conditions where the water surface is cresting the road, most likely submerging the spillway. In this case (and assuming you’ll be breaching some other part of the embankment), I would treat the spillway and culvert as one structure-an inline structure in RAS. Model the culvert as a gate. You’ll have to either use a rectangular shape to approximate the culvert, or come up with a user-defined rating curve. The rating curve could be easily determined by setting up a different geometry file with this crossing modeled as a cmp pipe-arch culvert. Then run a number of different steady flows through it. This will give you a good rating curve. Then import it as a use-defined rating curve for your gate. Perhaps you increase the entrance loss coefficient slightly to account for energy loss as flow lines contract and expand over the spillway structure before entering the culvert.

Under normal flow conditions, I would set up two geometries-one with just the culvert, and one with just the spillway. Then look at the conditions you are most concerned with and pick the geometry that controls the flow at the structure (whichever geometry produces a higher headwater elevation for a given flow amount). If you really want to see a full unsteady flow simulation (where control is switching from spillway to culvert, and back to spillway, then you’ll have to break the model up into multiple simulations, with the end of the previous simulation used as the initial conditions for the next one (using a restart file). You’ll want to split the simulations up where control switches from spillway to culvert. This will take some trial and error work.

Friday, December 19, 2008

What are the limitations of HEC-RAS???

Written by Chris Goodell, P.E., D. WRE | WEST Consultants
Copyright © RASModel.com. 2008. All rights reserved.

There are certainly some limitations to HEC-RAS: Steep bed slopes (User's manual says >10%), multi-dimensional flow characteristics, complex pipe systems, etc, etc. However, I recently discovered that HEC-RAS is capable of handling enormous data sets. I put together a model of the ice age Missoula Floods, simulating the "breaking" of an epic-sized ice dam near the Montana-Idaho border. In short, the resulting flood wave traveled through the pan-handle of Idaho, south through Eastern Washington, through the Columbia River gorge with a side trip up the Willamette River in Oregon, and finally out to the Pacific Ocean. The overall simulation was about 1 month long, and it took 7 days for the flood wave to travel from the ice dam to the Pacific Ocean. So I guess the lesson learned is, as long as you work within the bounds of HEC-RAS's applicability, there is really no model too large for it to handle. For more details, you can check out the paper I presented at the EWRI2008 conference in Honolulu.

Thursday, December 18, 2008

UN-interpolating Cross Sections

Written by Chris Goodell, P.E., D. WRE | WEST Consultants
Copyright © RASModel.com. 2008. All rights reserved.

I occasionally run into the desire to un-interpolate cross sections. I don't mean "delete" them, but to make them "real" cross sections, not interpolated. Typically this is so that I can interpolated between interpolated cross sections-if that makes any sense. Here's an example...you might have a set of surveyed cross sections that you want to merge with terrain cross sections you've cut in GIS. You have much more finely spaced cross sections from GIS and you want to merged the surveyed cross sections into the terrain cross sections. This is going to require you to interpolate between two cross sections to a specific location. RAS will allow you to do this, but will only allow you to do one cross section at a time. And it won't allow you to interpolate between interpolated cross sections. Therefore, you will have to uninterpolate your new cross section, so that you can interpolate between it and the next downstream surveyed cross section.

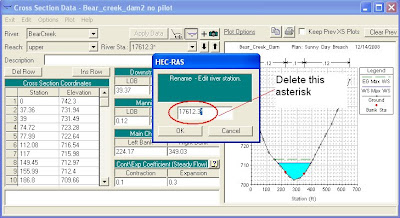
It's very easy to uninterpolate. Just go to the cross section editor and scroll to the interpolated cross section you want to fix. All interpolated cross sections in RAS end with an asterisk (*). In the editor, go to options...rename. Then just delete the asterisk. When I do this, I'll usually write a note in the description box saying that this is actually an interpolated cross section, even though it no longer has the asterisk. Here's the problem...if you ever want to make it an interpolated cross section again, you can't rename it and add an asterisk. RAS won't let you. In this case, you'll have to open up the geometry file in a text editor, find the cross section you want to chage and manually add in the asterisk at the end of the River Station.

Monday, December 15, 2008

Merging Ground Survey with DTMs

Written by Chris Goodell, P.E., D. WRE | WEST Consultants
Copyright © RASModel.com. 2008. All rights reserved.

When I have a digital terrain model and some ground survey (or more specifically, hydrosurvey) points, I like to make use of the merge tool in RAS found in the graphical cross section editor. The first thing you have to do is bring your ground points into GIS. Then, cut all of the cross sections you want in GIS, making sure to account for changes in roughness, channel shape, bed slope and to satisfy numeric requirements. Also, be sure that you cut a cross section over each of the sets of groound survey points. It's important that these are located in the same position (as shown below).

Create 2 geometry files. One with only the ground surveyed cross sections, and one developed from the DTM. In the ground surveyed geometry file, you'll want to interpolate cross sections so that you have a matching cross section for each DTM-created cross section. The interpolation routines in HEC-RAS work great here. They'll allow you to actually specify where you want the interpolated cross section to be (in this case, select the location of it's matching DTM section). Now you'll have two geometry files with the same number and identically-stationed cross sections. Only one file will be strictly ground survey points and the other will be terrain model points.

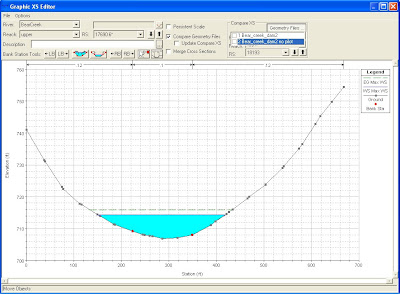
Now, open the DTM geometry file, and go to the graphical cross section editor. Select the Compare XS Geometry button and select the Ground Points Geometry File. Because you properly interpolated sections to match the DTM geometry, the River Stations for both geometry files should line up. Now click the Merge box. For each cross section, simply shift the main channel (ground points geometry) until it lines up with it's DTM counterpart cross section. You can do this by manually entering an offset distance, or by holding the shift key and pressing the left or right arrow key. Once you have them lined up, move the red merge boundary lines until you have the main channel sitting squarel inside them. Hit the merge "Inside" button and the newly merged cross section has been created.

Friday, December 12, 2008

Failing Bridges

Written by Chris Goodell, P.E., D. WRE | WEST Consultants
Copyright © RASModel.com. 2008. All rights reserved.

In large flood studies, it's common for bridges to be impacted or overtopped by flood waters. A bridge holding back a lot of water, suddenly failing, could send an evern greater surge of water downstream. Some states require that bridges be failed during a dam breach simulation, if they are overtopped by a certain amount.

So, how do we fail bridges in HEC-RAS? There is no direct way, like we have with inline structures. However, by getting a little creative you can still simulate a failing bridge.

Try modeling the bridge as an inline structure. Youll have to model the bridge opening as a "gate", or series of gates (the piers could be modeled as the space between gates). Keep the gates fully open throughout the simulation and make sure that you calibrate the new inline structure to match the existing bridge structure. Tweak coefficients, adjust gate openings, whatever it takes to simulate the bridge over a wide range of flows. Then put in a breach like you would at a dam and you'll be able to fail it based on overtopping, overtopping with a duration, or at a specific time in the simulation.

This figure shows the original bridge.
And here is the same bridge modeled as an inline structure...
You might also try splitting the reach at the bridge. This works well if you expect to have a failure on the bridge approach embankment, as opposed to the bridge structure itself. Split the reach at the bridge into 2 parallel reaches. You'll have a divergence junction upstream and a convergence junction downstream of the bridge. Model the bridge deck and opening on one reach, and the embankment on the other. Then fail the embankment side.

Another option would be to place a "fake" lateral structure just upstream of the bridge. Connect it to the cross section just downstream of the bridge. In this example, you'll want to use the upper chord of the bridge for the lateral structure's crest profile. Keep the bridge structure (openings, piers, abutments, etc.) in the model as a bridge, but make the high chord of the deck and approach sufficiently high so that it never overtops during the simulation. We want the lateral structure to handle the overtopping flow and the original bridge to handle the pressure flow. Then put the breach data in the lateral structure and fail it based on your bridge failure overtopping criteria. This one is also good if you expect the failure to occur in the embankment.

Personally, I like the first option the best. It's easy to set up and easy to calibrate. Plus it looks more "real" than the other two.

Anyone have any other ideas for failing bridges in RAS???

Thursday, December 11, 2008

Little known secret...

Written by Chris Goodell, P.E., D. WRE | WEST Consultants
Copyright © RASModel.com. 2008. All rights reserved.

I usually get a huge "AWESOME!" when I share this simple, but not well known trick in HEC-RAS.

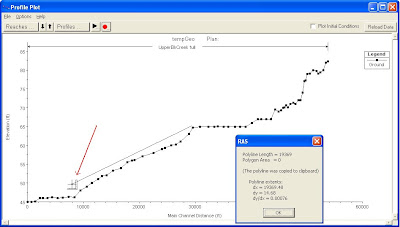
In any graphical plot in HEC-RAS, hold down the control key and look what happens to the cursor. I changes from a pointer to a "cross-hairs" with a measuring square. You have just put yourself in "measuring" mode. With this you can click and drag a line, and RAS will tell you the dx, dy, total length, and the slope, dy/dx. If you draw a polygon, it will give you the polygon area. Great for getting bed slopes off of profile plots. I also use it for measuring main channel widths on cross section plot, and for measuring reach lengths on a georeferenced schematic.

Wednesday, December 10, 2008

Criss-Crossed Cross Sections


Written by Chris Goodell, P.E., D. WRE | WEST Consultants
Copyright © RASModel.com. 2008. All rights reserved.

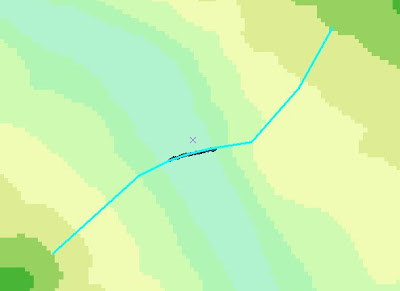
It happens to the best of us. Occasionally, we import GIS cross sections that we accidentally drew in backwards (i.e. right-to-left looking downstream, instead of the required left-to-right). As a result, you can get a criss-cross deal where the correctly drawn and incorrectly drawn cross sections are located (see figure). You can also tell something's wrong when the River Station label is on the right side of the cross section (looking downstream). RAS always places that label on what it thinks is the left side of the cross section.
It's very easy to fix. Simply left-click on the cross section you want to fix and select "Reverse XS Stationing". Of course you could always go back to your GIS application and redraw (or reverse) each cross section, but who wants to do that?

A brief look at the DSS Viewer

Written by Chris Goodell, P.E., D. WRE | WEST Consultants
Copyright © RASModel.com. 2008. All rights reserved.

It's shoved, all the way to the right, the end of the line of quick access buttons on the Main HEC-RAS window. Almost like it deserves very little respect. It's even after the button for errors and warnings and notes (that nobody uses ;-)). I'm talking about the DSS Viewer. It may be pushed to the side on the main RAS window, but it's a great tool for viewing unsteady flow output.


Here's a quick run-down on how to use the DSS Viewer.

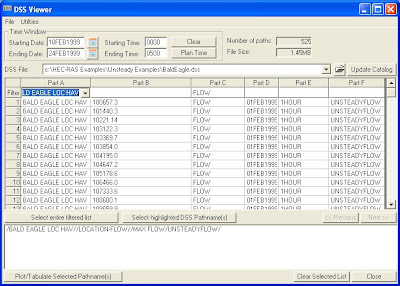
First make sure you have the correct dss file. Most dss files have a TON of data in them, assembled into records or "paths". It makes life much easier if you filter out what you don't want to see, so that you can easily select the desired path . Start with "Part A". Select the river/reach you want to look at by clicking on the cell directly under the column header labeled "Part A". For "Part B", you'll select the river station your interested in. If you want to look at a reach-wide plot, leave this cell blank. In "Part C", you specify what data you're after. Flow, Stage, Gate Opening, etc., etc. Keep in mind that at an inline weir, the flow is broken up into different flow components (flow-weir, flow-gate, etc.). If you're looking for the total flow at the inline weir, select "flow-total". At a cross section, you'll want to select "flow". In "Part D", you'll select the starting date/time for a block of time-series data. For "Part E", select the time interval you want to plot(1DAY, 1HOUR, 1MIN, etc). Finally in "Part F", you'll select the plan file you want to look at. You'll notice that after selecting a specific part (A through F), the records in the filtered list reduce-eventually to a manageable number where you can easily select the desired path. Once you see the path you are interested in, either double-click it or single click it and press "Select highlighted DSS Pathname(s)." The it drops into the bid below and you are able to view it as a plot or table. To my knowledge, there is no limit to how many paths you can put in the bin.
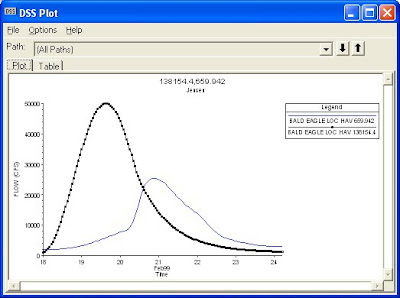
First of all, you can use the dss viewer to view hydrograph plots at 2 or more different locations on the same plot. Can't do that in the Stage and Hydrograph plot. It's a great way to visualize the attenuation of your flow hydrograph through your reach . Just select the two (or more) locations you want to compare by clicking in the blank cell below "Part B" and selecting the desired river stations.
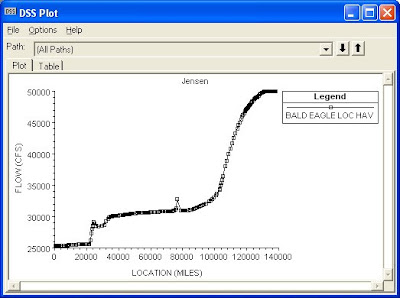
You can also use it to get a plot of maximum flow values for an entire reach (see figure to left). RAS has the Max WS profile, but that does not necessarily correspond to maximum flow. To do this, select the blank cell under "Part B", then in "Part C", select LOCATION-FLOW. Leave "Part D" blank and then select MAX FLOW under "Part E".
And of course, like other RAS plot graphics, you can always click on the "Table" tab to get the data in tabular form. Great for copying and pasting to Excel, if you need to manipulate the data or just create a custom plot.

Tuesday, December 9, 2008

The HEC-RAS Debug Report


Written by Chris Goodell, P.E., D. WRE | WEST Consultants
Copyright © RASModel.com. 2008. All rights reserved.

This is a very convenient new utility the fine folks at HEC included in the new version 4.0 of HEC-RAS. The Debug Report is found under the File menu item of the main RAS window. In short, clicking this will wrap up all of the input files of the currently open plan of your RAS model and package them into a nice zip file. This will allow you to send your model to anyone via email very quickly and easily. Gone are the days where you have to pick through your RAS model directory for all the *.prj, *.p##, *.g##, *.u##, and *.f## files, only to find out later that you forgot a critical input file. Once click of the "debug report" and you have a nice zip file that's ready to email.


My guess, is it's called a "Debug Report" because members of the HEC-RAS team would ask a Corps employee for their data set, so that they could debug a problem. I know from personal experience that all-too-often, the data set would be missing the extrememly important *.prj file.


So next time you have to send someone your model, just click the "Debug Report" and off you go.


Just a note...with the debug report, your model recipient will have to rerun the model on their end before they'll be able to see any output.

Guard Rails...

Written by Chris Goodell, P.E., D. WRE | WEST Consultants
Copyright © RASModel.com. 2008. All rights reserved.

I get this question occasionally...Do I include guardrails on my bridges and culverts as part of the deck station and elevation points? I understand the question here-guardrails, or fencing can be relatively "porous" when the bridge is overtopping. In fact, it's quite conceivable that the bridge could be overtopping, but all the flow is under the guardrail, in which case you would think, "why not leave out the guardrail all together?". However, I think in most cases you should include the guardrail as part of the upper deck. The reason-debris. In most rivers during flood stage, there will be considerable debris floating around. Tree trunks/branches, garbage, cars...etc. It does not take much to plug up the opening under or through a guardrail. So conventional wisdom is you assume the opening at a guard rail will get plugged up during the flood and model it accordingly. It's also the "conservative" approach-meaning this approach might overestimate the extent of flooding. Here's an example of a culvert crossing, with the guardrail included in the upper chord geometry:

Monday, December 8, 2008

Profiles that intersect-Not Good!

Written by Chris Goodell, P.E., D. WRE | WEST Consultants
Copyright © RASModel.com. 2008. All rights reserved.

Have you ever plotted out your profiles (10-year, 50-year, 100-year, whatever) only to see two profiles intersecting? It's maddening, because you know it's not possible (unless you have something like a levee breach). But if there's not physical explanation, there must be a numerical fix for it. Sometimes, just adding in a few more cross sections in the reach where the intersection occurs will fix the problem.


Everything's the same...why are my answers different???

Written by Chris Goodell, P.E., D. WRE | WEST Consultants
Copyright © RASModel.com. 2008. All rights reserved.

This seems to happen more often than it should. You have two RAS model runs. Everything in the geometry, flow, and plan files are exactly the same. Yet, the output is slightly different. This can cause a lot of anxiety, particularly if you're doing a FEMA "Duplicate Effective Model" where the two models must agree EXACTLY. Usually the cause of the discrepancy is some obscure computation setting in the plan file, or maybe how the friction slope or conveyance is computed. However, I ran into a case recently where it was simply a bug in RAS.

When RAS runs a multiple profile run, it apparently holds over some of the internal computations of the previous profile to begin comps for the new profile. RAS must guess at the first wsel solution during the backwater computations. It then runs through the computations and compares the result with the guess (standard trial and error, iteration). It continues until it arrives at a solution where the guess and the result are consistent within the prescribed tolerance. The problem here is how RAS establishes that first “guess”. If it is the first profile run, I think RAS simply uses the downstream computed wsel and translates that upstream as the first guess for the next upstream cross section. If it is a second (or third, or fourth, etc) profile run, I think RAS uses the resulting water surface elevation from the previous profile run as it’s first guess.

If I’ve confused you, no matter, it’s really very easy to fix. Just rearrange the flows in your profile table, so that the 100-year profile is listed first (so yours would be 100-yr, 10-yr, 50-yr, 500-yr) in that order. That way RAS computes the 100-year first. Then the answers will compare exactly.

An even easier fix would be to go into the “Set Calculations Tolerances” under the Options menu item in the Steady Flow Analysis window. Change your water surface calculation tolerance to 0.001 for BOTH plans, and you should see the same results for the 100-year profiles, without having to rearrange in the flow file.

Thursday, December 4, 2008

HEIC Conference

Well, it looks like I'll be heading to Chile next month for a conference in Concepcion. I'll be presenting a paper on the design of tide gates using HEC-RAS. As part of the continuing education part of the conference, I'm teaching a class on HEC-RAS the following week. Should be fun.

The conference will be held at the University of Concepcion and it's actually a joint conference between the 7th International Symposium on EcoHydraulics and the 8th International Conference on Hydroinformatics. http://www.heic2009.org

Wednesday, December 3, 2008

Unsteady flow and Junctions

Written by Chris Goodell, P.E., D. WRE | WEST Consultants
Copyright © RASModel.com. 2008. All rights reserved.

I was checking over a model yesterday and stumbled across a somewhat uncommon, but annoying issue with HEC-RAS unsteady flow specific to junctions. At a junction, for unsteady flow modeling, RAS will just translate the downstream water surface elevation to the two upstream cross sections. (*UPDATE-Version 4.1 now has the "Energy Balance Method" for unsteady junctions.  That will solve the problem described in this post.  However, if only works for convergence junctions, not divergence junctions (i.e flow splits).  If you have a divergence junction, you will have to use the technique described below until version 4.2 comes out.  Version 4.2 will allow the Energy Balance Method for Divergence Junctions as well)
Normally this causes no problem at all and is not even noticeable (i.e for relatively shallow bed slopes and relatively large depths-IOW, most natural rivers). However, in cases where you have a steep reach with relatively shallow depths, the upstream cross sections will have an extremely shallow depth, which backs out a high velocity and large velocity head. In turn, the next cross section upstream must balance this high velocity head with a correspondingly high depth-and the see-saw pattern ensues (see left).


Under this scenario, the cross sections MUST be set very close to the junction point, to avoid the problems associated with this limitatin in the model. You can do this by either going out and resurveying new cross sections (boo), or copying the junction-bounding cross sections to locations very close to the junction (better). Just copy the cross section and then adjust the elevations of the copied cross sections to match the bed slopes. Make sure you adjust the junction lengths and cross section reach lengths accordingly. Then you’ll see a result more like this…


Obviously you’ll see that I interpolated some cross sections throughout the reach. For as steep as it is, it needed more.


The obvious question then is, "how close do I need to get the cross sections to the junction?" Well...it really depends on how steep the reach is and how shallow the water is. Generally I get them close enough so that the water surface at the upstream cross section is deep enough to avoid an over-correction in the energy loss. This figure might help to explain:

Tuesday, December 2, 2008

Samuel's Equation for Cross Section Spacing

Written by Chris Goodell, P.E., D. WRE | WEST Consultants
Copyright © RASModel.com. 2008. All rights reserved.

I just got a call from a colleague of mine about Paul Samuel's equation for cross section spacing in 1-D unsteady flow models (like HEC-RAS). Samuel's equation reads DX = 0.15*D/S, where DX is the cross section spacing, D is the Depth and S is the bed slope. So the question was, which depth do you use?

Well Samuel's equation (Samuels, P.G., 1989. “Backwater lengths in rivers”, Proceedings -- Institution of Civil Engineers, Part 2, Research and Theory, 87, 571-582.) was developed for bankful depth. In his derivation, Samuel uses Manning's equation for conveyance, which is a function of the hydraulic radius. His switch to bankful depth for his final equation is two-fold. One for convenience (a depth characteristic is easier to measure in the field than hydraulic radius), but also because bankful depth typically yields the maximum hydraulic radius for typical flood flows in a natural channel.

That being said when running extreme events in HEC-RAS, such as a dam breach, more consideration for a larger depth should be given. Though conventional wisdom has been that closer cross sections for implicit solution schemes (like RAS) make for a more stable model, this is not necessarily true with HEC-RAS. And, in fact, cross section spacing too close can overestimate energy loss and precipitate significant error, and eventually numeric instability.

The bottom line, and I mention this every time I go over cross section spacing with students, is use an equation that seems to work for the rivers you work on to get a good starting point for spacing. Then adjust from there as necessary. You'll find that over time, you will rely more and more on the "eyeball" test, or gut-feel for determining spacing, rather than an equation or rule of thumb...

It's interesting to note that the first part of Samuel's paper derives a backwater length (thus the name of the paper). This is the length of channel affected by some disturbance downstream. The idea being that in the planning stage of a project, you could decide how long to make your model. This length (through a rather elegant numerical analysis of the St. Venant equations and Manning's equations, with a side order of Froude Number) turns out to be simply 0.7D/S. The 0.15 number in the cross section spacing equation is then simply (and very anti-climatically) 0.7 divided by 5, since in his experience, the number of cross sections needed to model a backwater reach is 5. For some reason, that is very funny to me...

Monday, December 1, 2008

Let's get this thing rolling.

Written by Chris Goodell, P.E., D. WRE | WEST Consultants
Copyright © RASModel.com. 2008. All rights reserved.
So I decided to set up a blog so that I can write about my experiences with HEC-RAS. I use this model almost daily at work. I even teach classes on it. I've gotten a lot of tech support calls over the years and often find myself wondering, "now how did I do that before?" It's annoying to me to have to reteach myself a method or procedure I've already done before, or to search around old emails to find that technique I sent someone 4 years ago. I'm hoping that this blog serves as a depository of tips/tricks/experience with HEC-RAS model that I and others can draw from. I also have a forum for HEC-RAS and hydraulic engineering questions in general. It's http://hecras.h2ls.comhttp://hecrasmodel.blogspot.com/p/hec-ras-bloggery-forum.html.

I hope to blog here frequently so that it becomes useful to others (as well as myself). Feel free to post responses-even suggestions if you feel so inclined...