
Written by Chris Goodell, P.E., D. WRE | WEST Consultants
Copyright © RASModel.com. 2008. All rights reserved.
It's shoved, all the way to the right, the end of the line of quick access buttons on the Main HEC-RAS window. Almost like it deserves very little respect. It's even after the button for errors and warnings and notes (that nobody uses ;-)). I'm talking about the DSS Viewer. It may be pushed to the side on the main RAS window, but it's a great tool for viewing unsteady flow output.
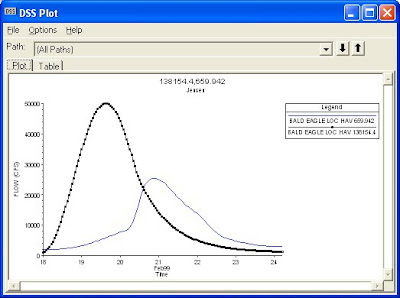 First of all, you can use the dss viewer to view hydrograph plots at 2 or more different locations on the same plot. Can't do that in the Stage and Hydrograph plot. It's a great way to visualize the attenuation of your flow hydrograph through your reach . Just select the two (or more) locations you want to compare by clicking in the blank cell below "Part B" and selecting the desired river stations.
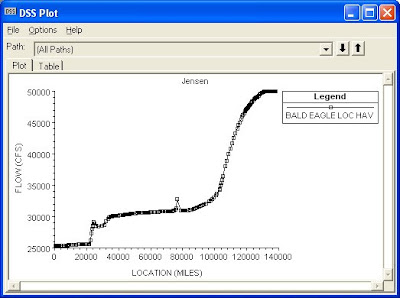 You can also use it to get a plot of maximum flow values for an entire reach (see figure to left). RAS has the Max WS profile, but that does not necessarily correspond to maximum flow. To do this, select the blank cell under "Part B", then in "Part C", select LOCATION-FLOW. Leave "Part D" blank and then select MAX FLOW under "Part E".
Copyright © RASModel.com. 2008. All rights reserved.
It's shoved, all the way to the right, the end of the line of quick access buttons on the Main HEC-RAS window. Almost like it deserves very little respect. It's even after the button for errors and warnings and notes (that nobody uses ;-)). I'm talking about the DSS Viewer. It may be pushed to the side on the main RAS window, but it's a great tool for viewing unsteady flow output.

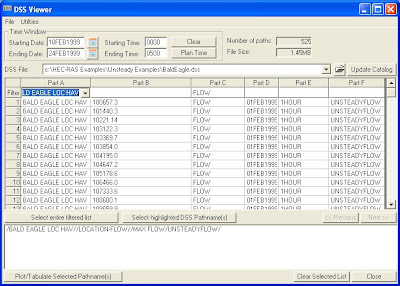
Here's a quick run-down on how to use the DSS Viewer.
First make sure you have the correct dss file. Most dss files have a TON of data in them, assembled into records or "paths". It makes life much easier if you filter out what you don't want to see, so that you can easily select the desired path . Start with "Part A". Select the river/reach you want to look at by clicking on the cell directly under the column header labeled "Part A". For "Part B", you'll select the river station your interested in. If you want to look at a reach-wide plot, leave this cell blank. In "Part C", you specify what data you're after. Flow, Stage, Gate Opening, etc., etc. Keep in mind that at an inline weir, the flow is broken up into different flow components (flow-weir, flow-gate, etc.). If you're looking for the total flow at the inline weir, select "flow-total". At a cross section, you'll want to select "flow". In "Part D", you'll select the starting date/time for a block of time-series data. For "Part E", select the time interval you want to plot(1DAY, 1HOUR, 1MIN, etc). Finally in "Part F", you'll select the plan file you want to look at. You'll notice that after selecting a specific part (A through F), the records in the filtered list reduce-eventually to a manageable number where you can easily select the desired path. Once you see the path you are interested in, either double-click it or single click it and press "Select highlighted DSS Pathname(s)." The it drops into the bid below and you are able to view it as a plot or table. To my knowledge, there is no limit to how many paths you can put in the bin.
 First of all, you can use the dss viewer to view hydrograph plots at 2 or more different locations on the same plot. Can't do that in the Stage and Hydrograph plot. It's a great way to visualize the attenuation of your flow hydrograph through your reach . Just select the two (or more) locations you want to compare by clicking in the blank cell below "Part B" and selecting the desired river stations.
 You can also use it to get a plot of maximum flow values for an entire reach (see figure to left). RAS has the Max WS profile, but that does not necessarily correspond to maximum flow. To do this, select the blank cell under "Part B", then in "Part C", select LOCATION-FLOW. Leave "Part D" blank and then select MAX FLOW under "Part E".
And of course, like other RAS plot graphics, you can always click on the "Table" tab to get the data in tabular form. Great for copying and pasting to Excel, if you need to manipulate the data or just create a custom plot.
This comment has been removed by the author.
ReplyDeleteThis comment has been removed by the author.
ReplyDelete