Pages

Friday, December 29, 2017

River Ice Modeling using HEC-RAS. New Forum!


Image courtesy JLH3Photography via Creative Commons.
license
Hello to everyone in the international River Ice Community! The RAS Solution has a new forum dedicated to river ice modeling with HEC-RAS.  This forum was developed for those who use HEC-RAS to simulate river ice covers and river ice jams. Please post your questions, comments, and insights in the HEC-RAS River Ice Modeling sub-forum which can be found here.  The RAS Solution is especially interested to hear how you have addressed difficult ice problems with HEC-RAS. 


HEC-RAS allows the user to model ice-covered channels with known ice properties, or to simulate wide-river jams. In the first case, the user specifies the ice cover thickness and roughness at each cross section. Different ice cover thicknesses and roughnesses can be specified for the main channel and for each overbank, and both can vary along the channel. In the second case, the ice jam thickness is determined at each section by solving the ice jam force balance equation. The ice jam can be confined to the main channel or can include both the main channel and the overbanks. The material properties of the wide-river jam can be selected by the user and can vary from cross section to cross section. The user can specify the hydraulic roughness of the ice jam or HEC-RAS will estimate the hydraulic roughness on the basis of empirical data. 


Image courtesy of Steven F.Daly, Ph.D., USACE ERDC/CRREL

The river ice capabilities of HEC-RAS were developed over 20 years ago through a joint effort by the HEC-RAS team at HEC and the Corps of Engineers’ Cold Regions Research and Engineering Laboratory (CRREL). Since that time, HEC-RAS with ice has been applied in rivers all around the world. It has been applied in river systems larger and more extensive than were imagined at the start. Recently, the HECRASController has been used to systematically vary the ice parameters over the course of hundreds (if not thousands) of separate simulations. 

Image courtesy of Steven F.Daly, Ph.D., USACE ERDC/CRREL


Tuesday, August 29, 2017

Having fun with HEC-RAS?

Written by Krey Price  |  Director, Surface Water Solutions
Copyright © The RAS Solution 2017.  All rights reserved. 


I’ve been seeing some cool applications of HEC-RAS from around the world lately. Here are some articles showing a few ways we’ve been putting HEC-RAS to use down under.

Making Middle Zealand
Did you know that the only thing keeping New Zealand’s two main islands from being split into three is a little 2-km wide piece of land just south of Auckland? What do you think would happen if you dug a ditch through this strip? Last time I drove across it, I asked myself that question…and then I let HEC-RAS tell me the answer! This article covers terrain manipulation and tidal boundary conditions in HEC-RAS with the construction of a canal that severs Northland from New Zealand’s North Island. The tides on either side of the island are out of phase with each other, so you get some really cool mixing with the alternating current. Have a read and give it a shot yourself!


Creating Rating Curves in HEC-RAS 2D Models
HEC-RAS does a great job providing you with rating curves for 1D models, but how about 2D? It takes a bit of additional effort, but this article walks you through the process of generating a rating curve from your existing 2D model. You may find – as we did in the example covered in the article – that the uncertainties in your rating curve are greater than you thought. Try it yourself by following along with this example, and see if you find yourself wanting to recalibrate your gauge!


Disappearing Terrain?
Do you get frustrated when your terrain disappears in HEC-RAS? Don’t fret, here are some simple workarounds for getting it back!  
 
My HEC-RAS Wish List
Speaking of workarounds, the HEC Spring 2017 Newsletter included a preview of what's new in Version 5.1 (see article on Page 20). They'll be adding some handy new features, but here's my HEC-RAS wish list that includes a compilation of suggestions gathered from hundreds of course attendees over the last year and a half since Version 5.0 was released. You may wish to submit your own on the Forum Page of the The RAS Solution.


Wednesday, August 16, 2017

1D/2D HEC-RAS Workshop in Brisbane Australia

ICE WaRM joins with internationally respected HEC-RAS authors and mentors to offer training in Version 5.0 of HEC-RAS, a highly regarded global water modelling package, available for free download and support from the US Army Corps of Engineers.

The new HEC-RAS Version includes two-dimensional floodplain modelling, unsteady sediment transport, bank erosion, water quality, and the RAS Mapper GIS interface.

Join us for a hands-on, 1-week overview of this latest version of HEC-RAS 1D+2D.  The week consists of five courses, run consecutively; that's 1 course per day for 5 days.  You can attend any combination of courses with respect to your level of experience and understanding.

WHAT:                 HEC-RAS Water Modelling: 1D+2D Hands-On Workshops
WHEN:                 Mon 11th - Fri 15th Sept 2017
WHERE                 BRISBANE, Queensland, AUSTRALIA
PRESENTERS:     Krey Price, Mark Forest, Rob Keller
REGISTRATION: 20% Discount for Early Bird Registrations by Mon 21st August 2017.
                              To gain another 20% Discount please add to Comments Field: “TP Aug Blog”
FULL DETAILS:    Click here.
FLYER:                  Click here.
CONTACT:            Trevor Pillar: tpillar@icewarm.com.au

See examples below:


Friday, June 23, 2017

New Geospatial editing tools coming in HEC-RAS Version 5.1

Written by Chris Goodell
Copyright © The RAS Solution 2017.  All rights reserved


New geospatial editing tools are currently in development for the next version of HEC-RAS-Version 5.1.  While no date has been set for the release of Version 5.1, it is expected sometime within the next year or two.  But no guarantees!  This will be an exciting new addition to HEC-RAS in that users will no longer be reliant on 3rd party software like ArcGIS or AutoCAD to develop geometric features like cross sections, river lines, flow lines, storage and 2D areas, etc.  All of this will be done within the HEC-RAS program environment.  And this will effectively eliminate the need for HEC-GeoRAS.

HEC recently published it's Spring 2017 Newsletter, which has a very nice article by Cameron Ackerman ,P.E., D.WRE on some of the new tools and capabilities that will be available within HEC-RAS Version 5.1 for extracting GIS information from digital terrain models.  The newsletter can be read here: 

http://www.hec.usace.army.mil/newsletters/HEC_Newsletter_Spring2017.pdf

Cameron's article on new geometric editing features in Version 5.1 starts on page 20.  

The new geospatial editing toolbar will serve as the base point for adding and editing geospatial features in HEC-RAS and will be docked to the RAS Mapper window.  It includes editing tools for adding new features, selecting/editing features, undo and redo, and  plotting terrain profiles.


With these tools, you'll be able to add geospatial features and interact with them directly within HEC-RAS.  Here you see the ability to move stream centerline points in RAS Mapper:


HEC also plans to have interactive help messaging while working in the geospatial environment to help the user identify errors in the geometry setup.  The following figure shows help messages for locations where bank lines do not intersect cross sections, which would result in missing bank stations.


These new features will make it much easier to identify problems with your model construction and fix those problems without having to leave HEC-RAS.  Here we see a poor definition of study limits not allowing for proper mapping of the flood inundation zone.  By quickly adjusting the study limit polygon, a more appropriate inundation map can be drawn.


This is just a brief preview of all of the exciting geospatial editing tools HEC-RAS will include in Version 5.1.  Please read the article by Cameron Ackerman in the HEC Spring 2017 Newsletter for more information.  

Tuesday, May 23, 2017

Wormhole Island - "What's the Best Shape for a Wormhole Culvert?"

Written by Krey Price  |  Director, Surface Water Solutions
Copyright © The RAS Solution 2017.  All rights reserved
A recent question was posted on the HEC-RAS blog regarding the optimal shape of the SA/2D Area Connection alignment for a wormhole culvert – in particular, whether a “Z” shape or “S” shape would be preferable. My apologies in advance for the drawn-out response, but I’ve had this question come up a number of times in class and thought I’d post some of my whiteboard sketches along with some random thoughts on the topic:
“Z” or “S”?
If you draw a “Z” shape, the order in which the vertices are entered will determine the direction of flow (always oriented from left to right looking downstream in HEC-RAS). The following image shows four different ways to draw a “Z”-shaped connection along with the associated orientation of flow that will be assumed in HEC-RAS. In the case of a wormhole culvert, flow could enter the “wormhole” at any of the green arrows (or at any point along each of the adjacent faces) and exit along any of the faces indicated by the red arrows. Wormhole culvert inlets and outlets typically wouldn’t be located along the diagonal segment of the “Z”, but directional arrows are shown along those segments to illustrate how the orientation of flow is preserved along the entire shape:

Read more here:

Tuesday, May 16, 2017

Putting Wormhole Culverts to the Test

Written by Krey Price  |  Director, Surface Water Solutions
Copyright © The RAS Solution 2017.  All rights reserved. 


The original post about “Wormhole Culverts” received thousands of hits, and many HEC-RAS users are now applying this method regularly in their models; but how valid are the hydraulics over the full range of open channel flow, pressure flow, and weir flow? Given the amount of use they are getting, it’s high time to put wormhole culverts to the test!

This test run assesses wormhole culverts against other approaches for modelling hydraulic structures in 1D and 2D model reaches.

The results show very similar water surface profiles between the various methods. The wormhole method provides the ability to correctly display terrain data for roadways and bridge decks in viewing plan and profile results.

While coupled 1D-2D reaches would still be required for detailed bridge designs in HEC-RAS, wormhole culverts appear to be a viable means of accounting for bridges and culverts with substantial terrain detail between the inlet and outlet that is subject to 2-dimensional flood flows.


Read more about the model setup and results here.


Monday, May 8, 2017

European HEC Software Workshop - London July 25-27 2017

JBA Consulting will be hosting another HEC Software Workshop this summer.

Back for 2017

This is the second software workshop in Europe dedicated to the HEC hydraulic and hydrological modelling software – HEC-RAS, HEC-HMS, HEC-DSS and HEC-ResSim.

We are working with the team at Hydrologic Engineering Center plus other leading users of the HEC software bringing you the chance to meet, learn, explore and discover the HEC software which is available for free.
This event will be packed with key-note presentations, master-classes, case studies and time to network with fellow modellers and researchers. The workshops and case studies will feature the latest thinking from some of the leading experts in this area, giving you practical solutions to take away with you. Offering you the flexibility of three ways to attend:
  • One day workshop
  • Two day training course
  • Three day event
There will be particular emphasis on HEC-HMS and the two day training course will focus on its use in flood forecasting, routing methods and rainfall-runoff approaches.

Check the following link for more information:
https://www.jbaconsulting.com/what-we-do/flood-and-water-management/hec-software-workshop/

Monday, May 1, 2017

Back to the Basics: Bank Station Placement - Part 2

Written by Martin J. Teal, P.E., P.H., D.WRE  |  Vice President, WEST Consultants 
Copyright © The RAS Solution 2017.  All rights reserved. 


Expanding upon Chris’ discussion of where to place bank stations, what should you do about high terrain somewhere in the middle of your cross section?  Here is an example:


How should we treat the left overbank?  It’s hard to tell if the high area next the left bank is isolated (i.e., it would be an island if the water surface were to get to elevation 370 or so) or if it is a continuous feature (such as a levee) that would prevent flow from accessing the left overbank until it is overtopped.  Looking at this another way, is the lower ground of the left overbank a continuous flow path or is it an isolated low spot (for example, a mining pit)? Aerial photography can often help determine the situation; here is the overhead view for our example:


The area in question is vegetated (the terrain goes up steeply when it gets to the storage yard on the bottom of the photograph) but it is hard to tell if the high point in the terrain would be constraining flow or if the low area is a potential flow path.  Looking at the cross sections upstream and downstream of the one in question will often provide answers, but does not help in this particular example.  In this case, the best course of action would be to go out to the river and see for yourself, then imagine how the water would behave.  Depending on your conclusion, there are several ways that this can be modeled.

1.  Isolated high spot.  If flow can simply go around the high spot in this particular cross section then we probably don’t need any further adjustments. You may get a “divided flow” warning in the output that signifies that the program detected dry ground with water on either side, but no action is needed to address the warning in this case. Assuming that the computed water surface elevation is high enough, this solution will also allow flow in the left overbank.

2.  Isolated low spot in overbank.  You could model this as per #1 above but in that case you should check flow distribution between the channel and overbanks up and downstream of this cross section for reasonable transitions (see earlier blog post from May 20, 2009).  Or, if you think that the low area should only store but not convey water you could set an ineffective flow limit as shown below.


3.  Continuous high ground.  If the high ground is really a ridge that would prevent the water from accessing the lower ground in the left overbank, it should be modeled as a levee. However, in this case another decision needs to be made depending on what happens after the levee is overtopped. Will the water be conveyed on the land side, or will it just pond?  If the latter you may need to add an ineffective flow limit at or just to the left of the levee.

4.  Something in between.  Regardless of whether the high or low features of the cross section are continuous, water is able to access the left overbank.  Natural streams often have “backswamp” areas behind either human-made or natural levees that flood and store water but do not really convey much flow downstream. If the left overbank in our example is like this, we could model it by using the ineffective flow limit as per #2 above.  However, ineffective flow means zero conveyance.  If we expect some water to move in the overbank, albeit very slowly, you may want to allow a small non-zero conveyance.  A few sharp-eyed readers may have noticed that we are using a Manning’s roughness coefficient of 0.3 in the left overbank. Using this value allows a small amount of conveyance in that overbank without zeroing it out completely.

Friday, April 21, 2017

Back to the Basics: Bank Station Placement

Written by Christopher Goodell, P.E., D.WRE  |  WEST Consultants 
Copyright © The RAS Solution 2017.  All rights reserved. 

Lately, I’ve seen a lot of basic bank station issues for models I have reviewed.  Some real basic stuff.  So I thought it would be good to go back to the basics a bit here and review proper placement of bank stations for cross sections in HEC-RAS. 

What do bank stations do for us?  First of all, they separate your channel into three distinct conveyance zones.  One for the left overbank, one for the main channel and one for the right overbank.  Not every application has multiple conveyance zones (i.e. canals), but most natural systems do.  By segregating out the different conveyance zones, we are using Manning’s equation to more appropriately determine energy loss through the system.  Here’s an example of a simple cross section with properly placed bank stations:


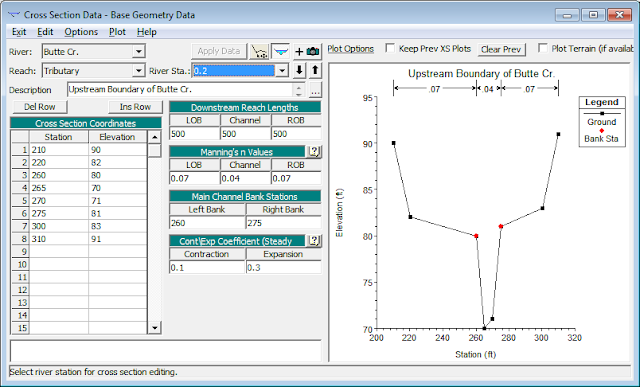
Notice the bank stations (the red dots on the plot) also reside at the grade break between the physical channel and the flatter overbanks.  While this is typically what is done, remember the correct placement should always be made based on the location of the change in conveyance.  For example, if you have a lot of thick vegetation down the banks of the channel, you might conclude that the excessive roughness there pushes the boundary between conveyance zones down closer to the toe of the banks like so:


Sometimes locating the bank stations are not as obvious as these examples.  For example, where should the bank stations be placed for a cross section like this?


One might initially conclude that the deeper channel should get the bank stations in which case you may place them like this:


However, it is important to know what is happening upstream and downstream of this location before you can make this decision.  Perhaps the smaller channel is actually the main conveyance and there just happens to be a large low-lying area in the left overbank. 


You would only know this by studying the reach above and below this spot.  Having nice aerial imagery behind the geometry schematic can help to make this decision for you. 


Notice in the figure above, the main channel is very obvious.  Even though there may be some low spots in the right overbank, we can clearly see where the main channel is and the bank stations have been placed accordingly.  It’s also important to point out that as you move through your reach, the placement of bank stations should be fairly consistent from cross section to cross section.  Changes in main channel width should generally be gradual from one cross section to the next. 

One of the most basic steps in constructing your HEC-RAS model is to go through every cross section and properly place bank stations.  If you are importing your cross sections from GIS (e.g. via GeoRAS), make sure that your bank line delineation placed the bank stations properly.  While your bank lines may look like they follow the conveyance boundaries well, you may see a very different picture once you’ve imported your cross sections and look at them in cross section view.  It’s always important to fine-tune your bank station placement in HEC-RAS after importing cross sections. 

As with most things in HEC-RAS, there are always exceptions to the rule.  The key thing to remember is that you want to place bank stations so that they capture the change in conveyance between the main channel and the overbanks and that the resulting main channel width doesn’t change too drastically from one cross section to the next.  

Friday, March 10, 2017

Rating Curves for Dams

Written by Jesse Rufener, P.E., CFM | GPD Group
Copyright © The RAS Solution 2017. All rights reserved.


Version 5 of HEC-RAS allows the use of rating curves for inline structures (and lateral structures).  Rating curves can be added through the Outlet RC feature in the inline structure editor.  Inline structure rating curves can be useful for evaluating the impacts of structures, such as labyrinth dams, where it may be difficult to correctly capture the geometry and/or flow properties within the inline structure editor.


Click the Outlet RC button and in the following menu you can add your rating curve based on upstream flow or water surface elevation. 


Please note that the rating curve must account for any influence of downstream tailwater as HEC-RAS does not with the rating curve option. 

When using the inline structure rating curve, the top of the dam must be above the highest elevation on the rating curve if you only want the rating curve to account for flow over the outlet feature.  You can check the Stage and Flow hydrograph to see how the rating curve is contributing to flow past the inline structure.  In the image below, the total flow is a combination of the rating curve and flow over the structure as I didn’t have the top of dam elevation set high enough in the first iteration.


Note that the peak flow is 34,471 cfs with a peak HW stage of 927.86.  When I raised the top of the dam to be above the top elevation of the rating curve, the peak flow is 33,967 cfs with a peak HW stage of 930.47 as shown in the Stage and Flow hydrograph below.  The peak flow rates are within 1.5%, but the peak HW elevations differ by almost 3’.


The Outlet RC feature is also available for lateral structures.