Pages

Wednesday, August 26, 2015

2D Modeling with HEC-RAS Training in Italy!

Who wants to meet up in Milan, Italy for some 2D HEC-RAS training?!?!  I’ll be giving this course with help from Antonio Cotroneo on November 10-12, 2015.  The course will be given in English with Italian translation.

This intensive, three day course will prepare the engineer and water resource professional to use HEC-RAS 5.0 for modeling two-dimensional
(2D) flow. Led by Chris Goodell, P.E. D.WRE Manager, Director of Applied Research. WEST Consultants, Inc. Portland OR (USA), with the collaboration of Antonio Cotroneo, Italian Hydraulic Engineer. The participants will learn how to approach and construct a 2D model for unsteady flow conditions, and to effectively view and analyze results. HEC-RAS 5.0 incorporates various aspects of 2D hydraulic modeling, including combined 1D and 2D systems.

TrainingSacramento


Follow the link for more information and to enroll:  https://drive.google.com/file/d/0B0bpiyLiUeRXZmtiZWpEQ05KMW8/view?usp=sharing


Please direct questions to Antonio Cotroneo at cotroneo79@gmail.com

Hope to see you there!

  20150203_122235


Friday, July 31, 2015

Using User-Defined Curves for Gates

Written by Christopher Goodell, P.E., D.WRE  |  WEST Consultants
Copyright © The RAS Solution 2015.  All rights reserved.

HEC-RAS allows for four different gate types that will compute the stage-discharge relationship of that gate for you based on the physical size/shape of the gate and a few empirical coefficients:  Sluice Gates, Radial Gates, Overflow Gates (closed top) and Overflow Gates (open air).  However, sometimes the built-in gate types don’t quite fit the gate that you want to simulate.  Or perhaps you have a unique spillway that can’t be captured adequately with the simple weir equation that HEC-RAS uses.  Either way, if you can come up with your own rating curve (state-discharge relationship) for the gate or hydraulic structure, you can model it accurately in HEC-RAS using the “User Defined Curves” gate type. 

image

As you can see, the User Defined Curves, although not a gate “type” in the literal sense, is added as the fifth gate type that you can choose from.  To use User Defined Curves, first add a new gate group to your inline structure (can also be used with lateral structures or SA/2D area connections) by entering in some geometric properties.  When using curves, the height and width are inconsequential-they don’t matter, because they won’t be used.  Just make sure that the height is at least as high as the highest gate opening setting you will use.  The invert is important, because that is what determines at what stage HEC-RAS will begin using the rating curves.  The centerline stationing just tells HEC-RAS how many gates you will have.  Again, the actual  stationing is inconsequential, just make sure you have the correct number of stations included.  Finally, enter in the user defined curves by pressing the Enter/Edit User Defined Curves… button. 

image

After entering the User Defined Gate Performance Curves window for the first time, you’ll notice that you must click on the “New” button image  to start a new set of curves.  Click New, then enter a name for the curves set. 

image

The first column, column 1, starting below the Gate Open Ht\HW entry, put in gate openings you wish to define curves for.  Each gate opening will have its own rating curve.  If you are putting in just a single rating curve (e.g. a spillway-maybe a morning glory type spillway), I always put in a zero gate opening curve in row 2 (with values of zero discharge for each headwater entry) and then the gate opening I wish to define goes in row 3.  No need for any more rows to be entered for single rating curves  The “zero” curve may or may not be necessary.  It seems to change with each new version of HEC-RAS.  Also, with a single rating curve, the gate opening value you enter in the first column really doesn’t matter.  It can be anything as long as it is equal to or less than the arbitrary gate height you defined in the gate editor AND it is the gate opening you use for the unsteady flow editor boundary condition (more on this in just a bit).  For a family of curves, you’ll want to put in a curve for a number of different gate openings, spanning the range of gate openings you plan to use in the simulation. 

Next enter in some headwater elevations (HW) in the first row.  You need at least 2 HW entries so that HEC-RAS can interpolate/extrapolate if necessary.  But the more HW values you enter, the more definition you’ll have.  The first headwater entry should be the invert of the gate (or spillway) and should get all zero values for discharge in that column.  The last headwater entry should be equal to or greater than the largest stage you expect to have in the forebay (although it doesn’t have to be, HEC-RAS will extrapolate). 

image

Press the Plot… button just to make sure that the curves look correct.

image

The final step is to go into the unsteady flow editor and set an internal boundary condition for the user defined gates.  You can select from Time Series Gate Openings (T.S. Gate Openings), Elevation Controlled Gates, Navigation Dams, or Rules).  Typically you’ll stick with one of the first two, the latter two are for advanced applications.  If you have a single rating curve, select T.S. Gate Openings and then just enter in the gate opening you have in the user defined curves for the entire simulation.  If you have a family of curves (as illustrated above), you can use T.S. Gate Openings or Elevation controlled gates, which ever suits your needs.  Elevation controlled gates allows HEC-RAS to determine how much to open the gate(s), based on the water surface elevation at a target location.  With T.S. Gate Openings, you simply tell HEC-RAS what the gate opening will be for each computation interval. 

image

Now you’re ready to compute.

Wednesday, July 8, 2015

Windows 8 Compatibility Issues

If you are a Windows 8 user and you are having trouble getting HEC-RAS Version 5.0 beta to work, Window's Program Compatibility Troubleshooter may solve the problem.  Problems usually arise when pressing the compute button.  One common message that pops up is "Error starting process.
Steady file not found."  The Program Compatibility Troubleshooter will fix this.

In Windows 8, you can get to the Program Compatibility Troubleshooter and learn how to use it for HEC-RAS by following the instructions here:
 http://windows.microsoft.com/en-us/windows-8/older-programs-compatible-version-windows

Thursday, June 25, 2015

Lifting Terrain in HEC-RAS 5.0

Written by Gerrit Kiers |  VIZITERV Consult Kft., Hungary
Copyright © The RAS Solution and Gerrit Kiers 2015.  All rights reserved.

Using Cross Section Data to add a levee


It is a common problem in hydraulic modeling that terrain data does not include the actual terrain underneath the water surface. With HEC-RAS 5.0 a terrain model can be improved by adding channel bathymetry to the existing terrain surface with the Cross Section Data (see Chapter 2 of the 2D Modeling User's Manual, or visit http://hecrasmodel.blogspot.com/2014/12/including-channel-bathymetry-into-your.html).

With this procedure it is also possible to locally lift the terrain, for instance on locations where a new levee alignment is planned. I use the Cross Section Editor to define a levee as an inverse channel that will be standing out above the existing surface. Then I create a levee terrain model and add that levee model to the existing terrain surface.

For the following example, I used the Muncie 2D HEC-RAS dataset that comes with HEC-RAS 5.0.0 Beta March 2015. One of its geometries contains break lines in the 2D Flow Grid. It is important to define break lines along the levees to make sure that flow across the cell faces is blocked by the elevation of the levee along the break line. In this example it is fortunate that these break lines were already defined so I was able to use their alignment for my levee.

000

For the definition of the levee I created a new geometry file and in this geometry I drew a river reach (Muncie levee) just on top of the break lines.

001

Constructing the cross section data for the new levee is rather straightforward. In this example I created the levee on a fixed elevation of 950 ft. There is no need to extend the side-slopes so that they touch the actual surface, but they do have to be pointing downwards. I added two identical cross sections on both ends of the levee.

002

There are two additional aspects to be aware of at this phase. First of all, make sure that the levee is wide enough to be represented in the terrain model you create. That is strongly related to the cell size of the terrain model. In this example a levee of 20 ft width will be more than sufficient as the Muncie terrain has a cell size of 5 ft x 5 ft Secondly, one also needs to check if the levee is consistently defined above the existing surface level, since we don’t want the levee to cut into existing terrain. If the alignment runs into natural high ground, one can locally lift the levee above the terrain level by adding extra cross sections. It is also possible to split the levee into separate reaches, before and after the high ground section.

With the current Beta version it is important to generate multiple cross sections by interpolation before creating the levee model. I opted for interpolation at every 100 ft.

007

At this point I was able to export the levee model as a terrain model. For this I used the ‘Create Terrain GeoTIFF from XS's’ option, accessible from the data file tree on the left in RAS Mapper. Right-click on the name of the geometry file you’re working in and select Export Layer… Create terrain GeoTiff from XS’s. In my example the ‘Channel Only’ option is sufficient. I named my terrain LeveeOnly.

008

There is only one step left, the joining of the original terrain model with the ChannelOnly terrain and the LeveeOnly terrain to create a terrain model that includes all features we want represented in the terrain. From RAS Mapper I invoked the menu option "New terrain" and added the different terrain models to the listing, as can be seen in the next screen capture. As the channel and levee must have higher priority for this procedure, they were moved to the top of the list.

010

The new terrain 'TerrainWithChannelAndLevee' includes both the channel bathymetry and the aligned levee.

016

On closer inspection we can see that there is an issue with the levee in one of its bends. Due to the cross section spacing of 100 ft, the LeveeOnly terrain appears cut off.  Tighter cross section spacing will improve this.  Notice that there is also an issue with the grid cells at this location. There is one 2D cell whose face does not match the break line alignment. Closer cell center spacing assigned to that break line should improve this situation.

017

Consequently, this bend will allow for some leaking along the different cell faces. In a real world situation I would need to address both issues before I can continue with my calculations. For now I neglect these and want to see how my new terrain performs.
For that purpose we can calculate one of the defined examples with the new terrain model. In the next screenshot we see the flooding caused by the upstream river levee breach with the original terrain, as modeled in the plan ‘Unsteady Run with 2D 50ft User n Value R’.

019

In the next screenshot we see the same flood event with the new terrain. It is clearly visible how the new levee performs in protecting lower areas, even though some leakage is visible. This leakage is due to the abovementioned issues in the terrain at the levee bend. This leakage can be eliminated by more refinement of the levee in the terrain (i.e. closer cross section spacing) and by better alignment of the adjacent cells using breaklines with smaller cell center spacing.

020

With this I hope to have demonstrated that the use of the Cross Section Data in HEC-RAS 5.0 is a very efficient tool for defining levee alignments in HEC-RAS 5.0. This new concept is relatively easy and can be used to define multiple terrain models with different levee alignments, which can be used in the evaluation of different flood protection scenarios.

Disclaimer: These model runs are only generated as examples to demonstrate the new abilities of HEC-RAS 5.0.0 Beta.

Gerrit Kiers is a Dutch hydrologist, working for VIZITERV Consult Kft. in Hungary.  Thank you Mr. Kiers for sharing your idea for terrain lifting in HEC-RAS 5.0!

Mr. Kiers' data set that demonstrates this technique can be downloaded here:  https://drive.google.com/file/d/0B0bpiyLiUeRXbC1rTmF4bUJvQjQ/view?usp=sharing


Tuesday, May 19, 2015

My Unsteady HEC-RAS Model is Unstable…Why?

Written by Christopher Goodell, P.E., D.WRE  |  WEST Consultants
Copyright © The RAS Solution 2015.  All rights reserved.

This question (or some variation of it) comes up quite a bit on The RAS Solution:  “I have an unsteady flow model.  When I run it, it goes completely unstable.  What is causing this?”  Many times a screen shot of the computation window with the dreaded “red bar” is attached.  

image

While the person asking the question genuinely needs help, what he/she doesn't understand is that it is impossible for anyone to troubleshoot his/her model with this limited amount of information or without the model data files.  There are an almost infinite number of possible reasons the model crashed.  

If I could sum up my approach to troubleshooting unsteady HEC-RAS models in one sentence, it would be
“HEC-RAS likes things to change gradually”

If your model is crashing, look for places or times where something is changing drastically.  It could be a sudden and significant change in the size and shape of the main channel from one cross section to the next.  It could be a sudden increase/decrease in flow.  It could be a sudden increase/decrease in stage.  Whatever steps you take to try to stabilize your model, make sure you are confident that the steps you are taking will improve stability without giving up more accuracy then you’re willing to sacrifice.  Haphazardly making changes and adjustments to your model without any forethought or strategy, in an attempt to make it stable could very well make it worse and get you nowhere-and waste a lot of time.  Making methodical, logical, and beneficial changes to your model is a much better approach.  By methodical, I mean understand what you are doing, and why it can improve numerical stability.  Also understand what accuracy (if any) you are sacrificing to achieve the increased stability.  Keep in mind, stabilizing your model may require more than one “change”.  This is why it is important to understand the theory behind the computations in HEC-RAS.  That understanding will allow you to make informed and intelligent decisions on what techniques to use to stabilize your model. 

Here are some very helpful references that deal directly with how to troubleshoot HEC-RAS unsteady flow models that are unstable and/or crashing.  If you’re having trouble with your unsteady flow model, please carefully read through these references.  And consider taking an HEC-RAS training course if you can.  The “Unsteady Flow” and “Dam Breach” classes both cover techniques for troubleshooting an unsteady flow HEC-RAS model. 
  • HEC-RAS User’s Manual Chapter 8, Performing an Unsteady Flow Analysis.  Particularly the section on Model Accuracy, Stability, and Sensitivity.  This manual (along with the Hydraulic Reference Manual) comes with the installation of the HEC-RAS software.  You can access it from the main HEC-RAS window under Help…User’s Manual.
image


image


[clip_image002%255B5%255D.jpg]

 Stabilizing a Dynamic Unsteady HEC-RAS Model.  Post on The RAS Solution.  Steps taken to stabilize a HEC-RAS model, along with the dataset used.  http://hecrasmodel.blogspot.com/2013/10/stabilizing-dynamic-unsteady-hec-ras.html


image


image


Thursday, May 14, 2015

The Projection File

Written by Christopher Goodell, P.E., D.WRE
Copyright © The RAS Solution 2015.  All rights reserved.

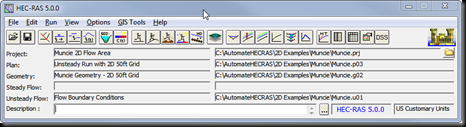
RAS Mapper is a window in HEC-RAS that allows you to preprocess 2D areas, map results, and manage background images.  In future versions of HEC-RAS, RAS Mapper will become more and more prevalent in our HEC-RAS modeling experience.  As I understand it, eventually RAS Mapper and the geometry editor window may merge to form the front-end interface for HEC-RAS, replacing the iconic “Main RAS Window”.
image

But that’s speculation.  What is not speculation is that if you want to use HEC-RAS 5.0 for anything more than a very basic model, there is really no getting around using RAS Mapper, and by extension…The Projection File!  The projection file defines a specific geographic coordinate system and projection and is somewhat of a new thing for us HEC-RAS modelers (it has actually been a part of RAS Mapper since it’s inception, but now with 2D modeling and web-imagery in Version 5.0, RAS Mapper is becoming an integral part of HEC-RAS modeling). The projection file requires us to know something about geospatial mapping (i.e. GIS), which we really haven’t had to know too much of before as RAS users.  But if you wish to use RAS Mapper, and you will, you need to understand what the projection file is and how to get one.  Without it, RAS Mapper is pretty much useless.  Adding a projection file to our RAS project establishes the project’s geospatial reference.  Projection files have the extension *.prj.  Be careful not to confuse this with the HEC-RAS project file, also with an extension *.prj.  They both reside in your HEC-RAS project directory, but only a properly formatted projection file will work in RAS Mapper for setting your projection.

The projection file is really just a simple text file with keywords in a specific format.  In fact, it is a single string written in “Well-Known Text” format, or WKT.  It’s simple, easy to read and was created by the Open GIS Consortium.  Here’s what a projection file looks like on the inside.  Notice that there are some keywords, identified by all CAPS, followed by some data related to the key-word, contained in brackets [  ].  I've color-coded it to make it easier to see what goes with what.  The purple color denotes the highest order in the hierarchy, followed by blue, then green, then red.  In other words, a red keyword is a “child” to a green keyword, green is a child to blue, and blue is a child to purple. 

image

Each keyword and the bracketed data that follows is called a “clause”.  The first and primary clause, PROJCS, stands for Projected Coordinate System.  The projected coordinate system is made up of the following sub-clauses:

1.  Geographic Coordinate System (GEOGCS), which is based on degrees latitude and longitude and contains the horizontal reference datum (DATUM), and the reference meridian for longitude measurements (PRIMEM).  DATUM also contains a description of the shape of the earth (SPHEROID), which in the example above is the Clarke Ellipsoid of 1866.  Units (UNIT) are inferred here only for the GEOGCS, in this case degrees.
2.   Projection (PROJECTION), which is the projection from geographic coordinates (lat/long) to projected coordinates.  This is essentially how the three-dimensional spheroid (Earth) is projected to a two-dimensional viewing medium.  In the example above, Transverse Mercator is selected, which uses the Universal Transverse Mercator (UTM) coordinate system.
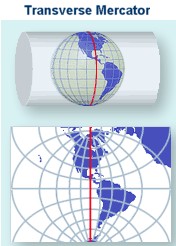

Cylindrical projection - transverse aspect © USGS

3.  Various projection parameter values (PARAMETER).  The parameter is labeled in quotations, followed by its value. 
4.  Units for the projected coordinate system (UNIT).  Here meters are used as the linear unit with a conversion factor of “1”.  The conversion factor converts the described units into meters.  If “FOOT_US” is used, then the conversion factor would be 0.30480060960121924.

There may be some additional clauses in your projection file, but the ones listed above seem to be typical.  All of the keywords used in WKT format with descriptions can be found at GeoAPI here.
You can write your own projection files and GeospatialPython.com presents a method (there are other examples out there, just Google it).  However, it is much easier and much more practical to find an already-compiled projection file and use that.  If you have a georeferenced HEC-RAS project already, every shapefile used to create your geometry components (stream centerline, xscutlines, flowlines, etc.) comes with a projection file.  Just find where it is stored on your computer and use that. 

If you don’t have the GIS files that were used to create your georeferenced HEC-RAS project, you can find projection files in at least three different places:  ArcGIS 10.0 or earlier, spatialreference.org, and the EPSG Projection Database.  If you know of others, please comment below!

When using any of these sources, make sure you pick the correct projection file.  You’ll know if it is the right one by bringing in web imagery to RAS Mapper and checking to make sure that everything lines up spatially correct.  ArcGIS (Versions prior to 10.1) includes a Coordinate Systems folder that contains more than 5,000 geographic, projected, and vertical coordinate systems.  Unfortunately, newer versions of ArcGIS do not come with that folder.  If you have ArcGIS 10.1 or newer or don’t have ArcGIS at all, you can access a large database of spatial reference systems at http://spatialreference.org/

image


If you go to spatialreference.org, make sure you only select from the EPSG, IAU2000, or spatialreference.org references.  The ESRI references only contain the GEOGCS clause in the projection file and not the complete PROJCS clause.  They will not work in RAS Mapper.   Once you’ve found the reference you want, click on it, then select “.PRJ File” from the list of available formats.  A projection file will then be downloaded to your computer and you are ready to use it in RAS Mapper.  There is a convenient Search box that allows you to search on key words for your reference.  For example, if your project is in Hawaii and you know your horizontal datum is NAD83, you can enter the keywords:  Hawaii NAD83, click the Search button and you’ll see the following list of spatial references:

image

Also available on line is the EPSG Projection Database, hosted on GoogleCode by geospatialpython.org.  Here you'll find a text file of a multitude of projection files in the correct WKT format that can easily be copied and pasted into your own projection file.

Once you’ve selected a projection file and assigned it to RAS Mapper, double-check that it is correct by adding web imagery.  If everything lines up, you are good to go.  The figure below shows the Muncie dataset in RAS Mapper, with an incorrect projection file assigned.

image

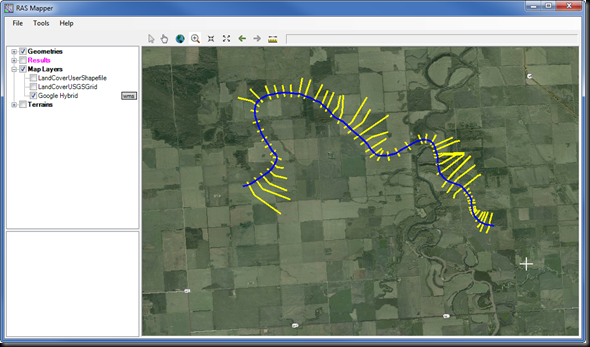
Obviously our streamlines and cross sections in this example are not correctly aligned in Muncie Indiana where they belong.  The incorrect projection file has landed us in the middle of Alberta, Canada!
image


Reassigning the correct projection file gets the model back to its correct spatial reference.

image

image

Does anyone know of any other sources of projection files that we can use in HEC-RAS?  If so, please comment below.

And here are some great follow-up comments from Dudley M.  Thanks Dudley for passing along this information!  "I was using RAS Mapper to set the SRS. From the menu Tools->Set Projection for Project. This brings up the "Spatial Reference Projection File" dialog where you can specify a filename. RAS Mapper will read the file and interpret as Chris described to get the coordinate system and projection.

I knew I had a valid ESRI projection file because it came from ArcCatalog. But RAS Mapper complained "Error - unable to make a projection with specified file. Make sure the file is a valid ESRI projection (*.prj) file." I looked in the projection file with a text editor. I saw that mine included a vertical datum clause. Chris didn't mention this in the post, so I thought maybe this was something RAS Mapper didn't like. The vertical datum information is introduced by the keyword VERTCS. I removed this entire part of the projection file and it worked.

But before it worked, I encountered another hitch. It's in that dialog "Spatial Reference Projection File." If you browse for a file and choose the same one you had before, the app does not read the file again. In other words, it doesn't refresh. I had to select a different projection file, choose OK, then go back and choose my edited projection file, and choose OK. For many minutes I was mystified why my edits to the file were not taking. I was making edits to the projection file in a text editor, then switching over to RAS Mapper and attempting to have it read the file again.

So if you get this error message even though you think you're giving RAS Mapper a valid projection file, try what I did."  

Wednesday, May 6, 2015

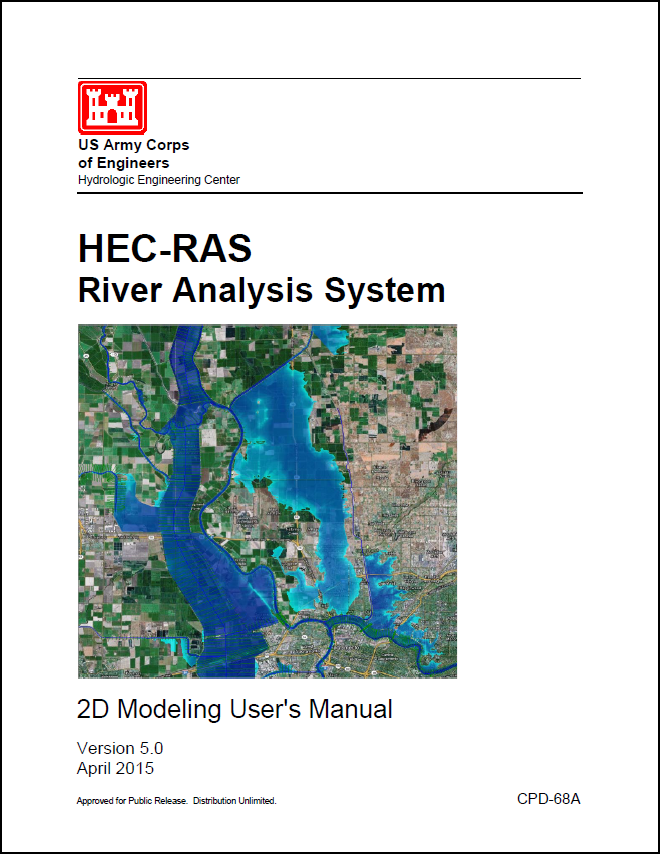
New HEC-RAS 2D Modeling User’s Manual

In advance of the final release of Version 5.0 (hoping for this summer), HEC has released its 2D Modeling User’s Manual, written by Gary Brunner, the HEC-RAS Team Leader.  This manual contains updates to all of the information that was put out in the previous guidance document, “Combined 1D and 2D Modeling using HEC-RAS” as well as more discussion on developing your terrain, creating the 2D mesh, combining with 1D elements, and avoiding errors and instabilities.

If you plan to run a 2D or combined 1D/2D model in HEC-RAS, please read this manual.  Mr. Brunner has done a fantastic job putting together this very well-written document with easy-to-understand instructions and guidance for setting up and running a 2D or combined 1D/2D model in HEC-RAS. 

You can get a free electronic copy of the HEC-RAS 2D Modeling User’s Manual here, or by clicking on the link on the side bar to the right. 
 
An excerpt from the Introduction:
“HEC has added the ability to perform two-dimensional (2D) hydrodynamic flow routing within the unsteady flow analysis portion of HEC-RAS. Users can now perform one-dimensional (1D) unsteady-flow modeling, two-dimensional (2D) unsteady-flow modeling (full Saint Venant equations or Diffusion Wave equations), as well as combined 1D and 2D unsteady-flow routing. The 2D flow areas in HEC-RAS can be used in number of ways. The following are examples of how the 2D flow areas can be used to support modeling with HEC-RAS:
    Detailed 2D channel modeling
  • Detailed 2D channel modeling
  • Detailed 2D channel and floodplain modeling
  • Combined 1D channels with 2D floodplain areas
  • Combined 1D channels with 2D flow areas behind levees
  • Directly connect 1D reaches into and out of 2D flow areas
  • Directly connect a 2D flow area to 1D Storage Area with a hydraulic structure
  • Multiple 2D flow areas in the same geometry
  • Directly connect multiple 2D flow areas with hydraulic structures
  • Simplified to very detailed Dam Breach analyses
  • Simplified to very detailed Levee Breach analyses
  • Mixed flow regime. The 2D capability (as well as the 1D) can handle supercritical and subcritical flow, as well as the flow transitions from subcritical
    to super critical and super critical to subcritical (hydraulic jumps).

2D flow modeling is accomplished by adding 2D flow area elements into the model in the same manner as adding a storage area. A 2D flow area is added by drawing a 2D flow area polygon; developing the 2D computational mesh; then linking the 2D flow areas to 1D model elements and/or directly connecting boundary conditions to the 2D areas.”

(Hydrologic Engineering Center, “HEC-RAS River Analysis System 2D Modeling User’s Manual Version 5.0”, Davis, CA.  April 2015.)